

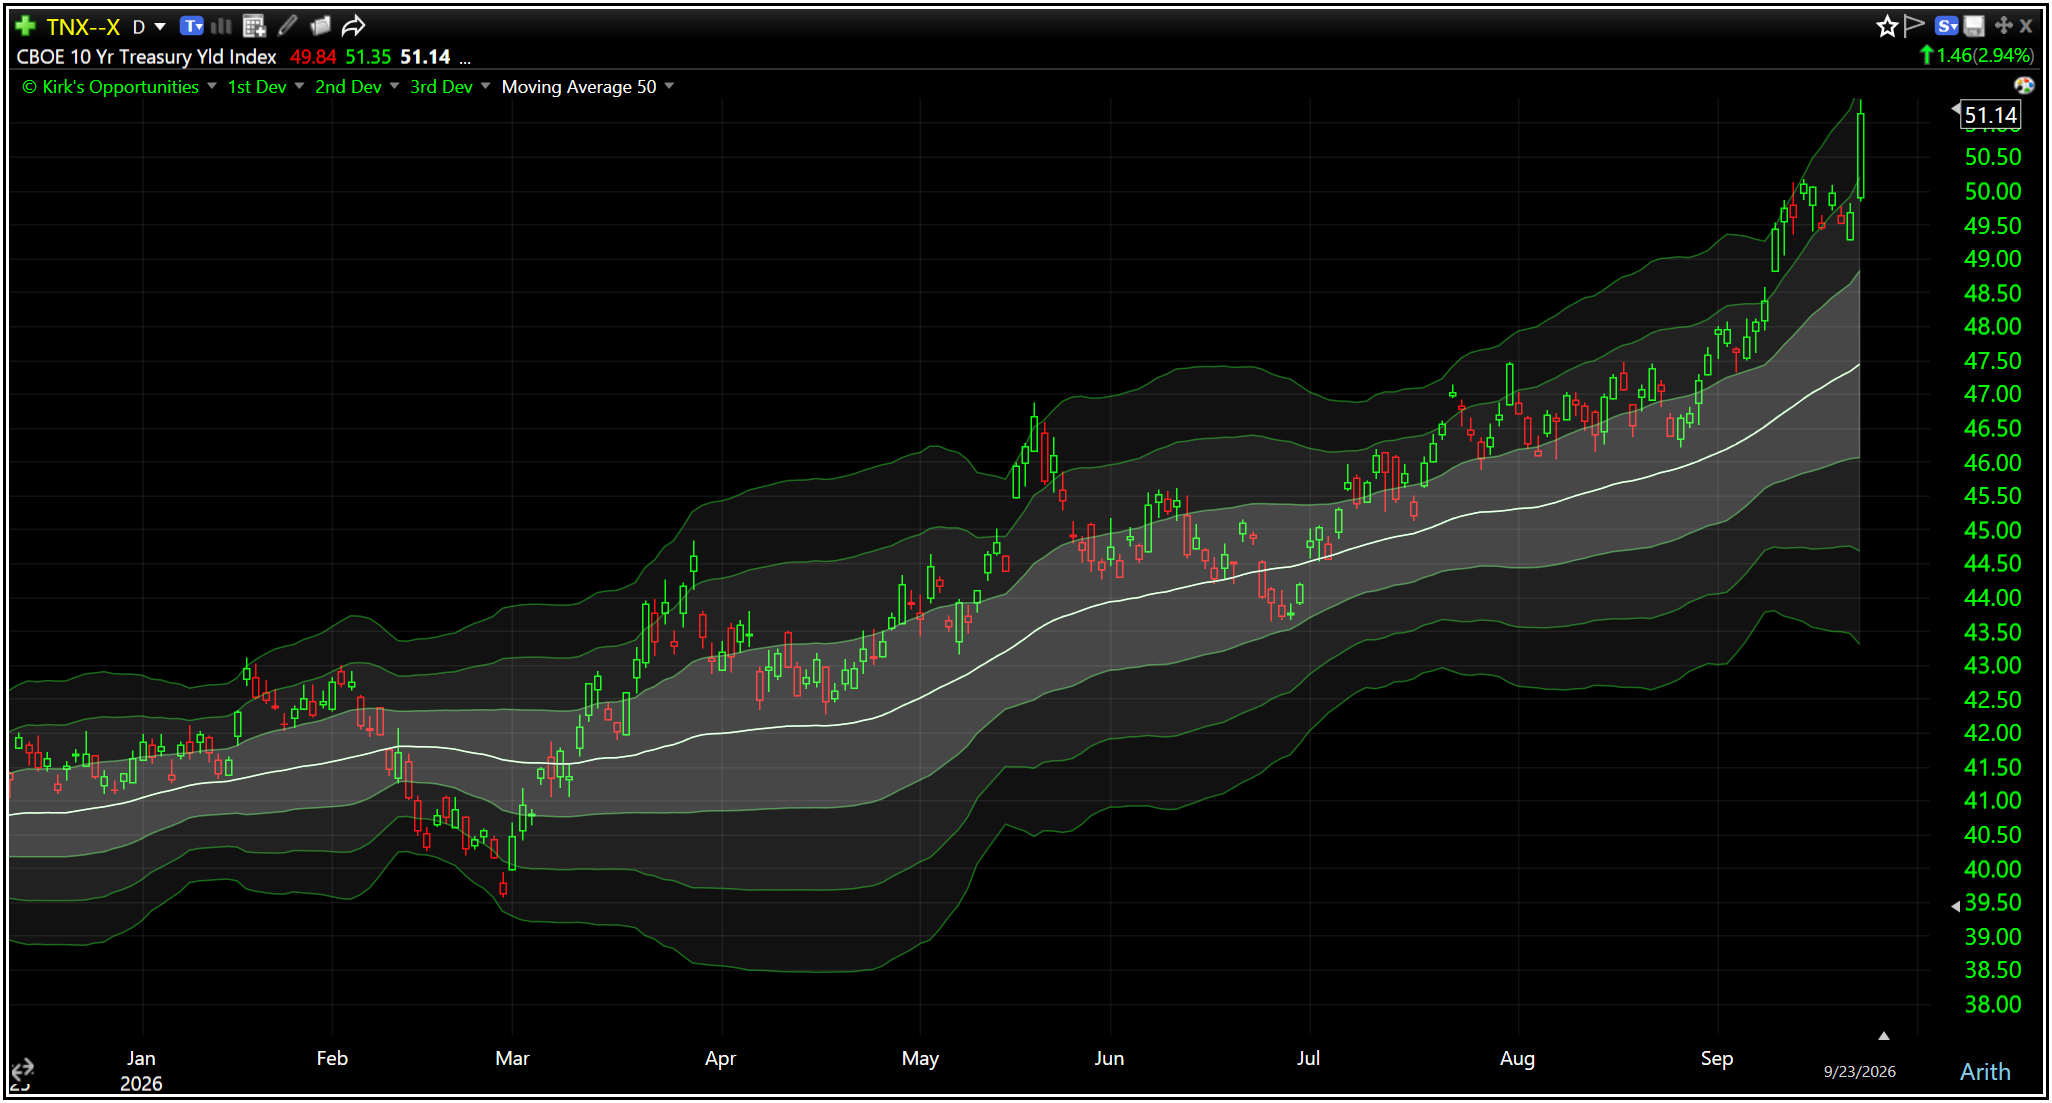
The 10-year Treasury yield is testing its third-deviation area, a zone that has repeatedly proved difficult to sustain during this uptrend.
Wednesday wasn’t really about the S&P 500 falling less than 1%.
It was about the 10-year Treasury yield pushing through 5%, oil moving back above $100, breadth deteriorating and small caps getting hit considerably harder. The closing percentages understated what changed beneath the surface.
The bond market delivered the clearest warning. Higher energy costs are again feeding inflation concerns. Strong economic activity is giving the Fed less reason to back away. Treasury buyers demanded more yield. And the 10-year surged to 5.113%.
But there was another side to Wednesday’s tape.
Several stocks and groups simply refused to participate in the selloff.
That’s where things get interesting.
The hurdle for stocks just got higher. Now we want to know whether Wednesday’s deterioration receives confirmation—and whether the stocks already fighting against it are showing us where the next opportunities may be developing.
MARKET CLOSE
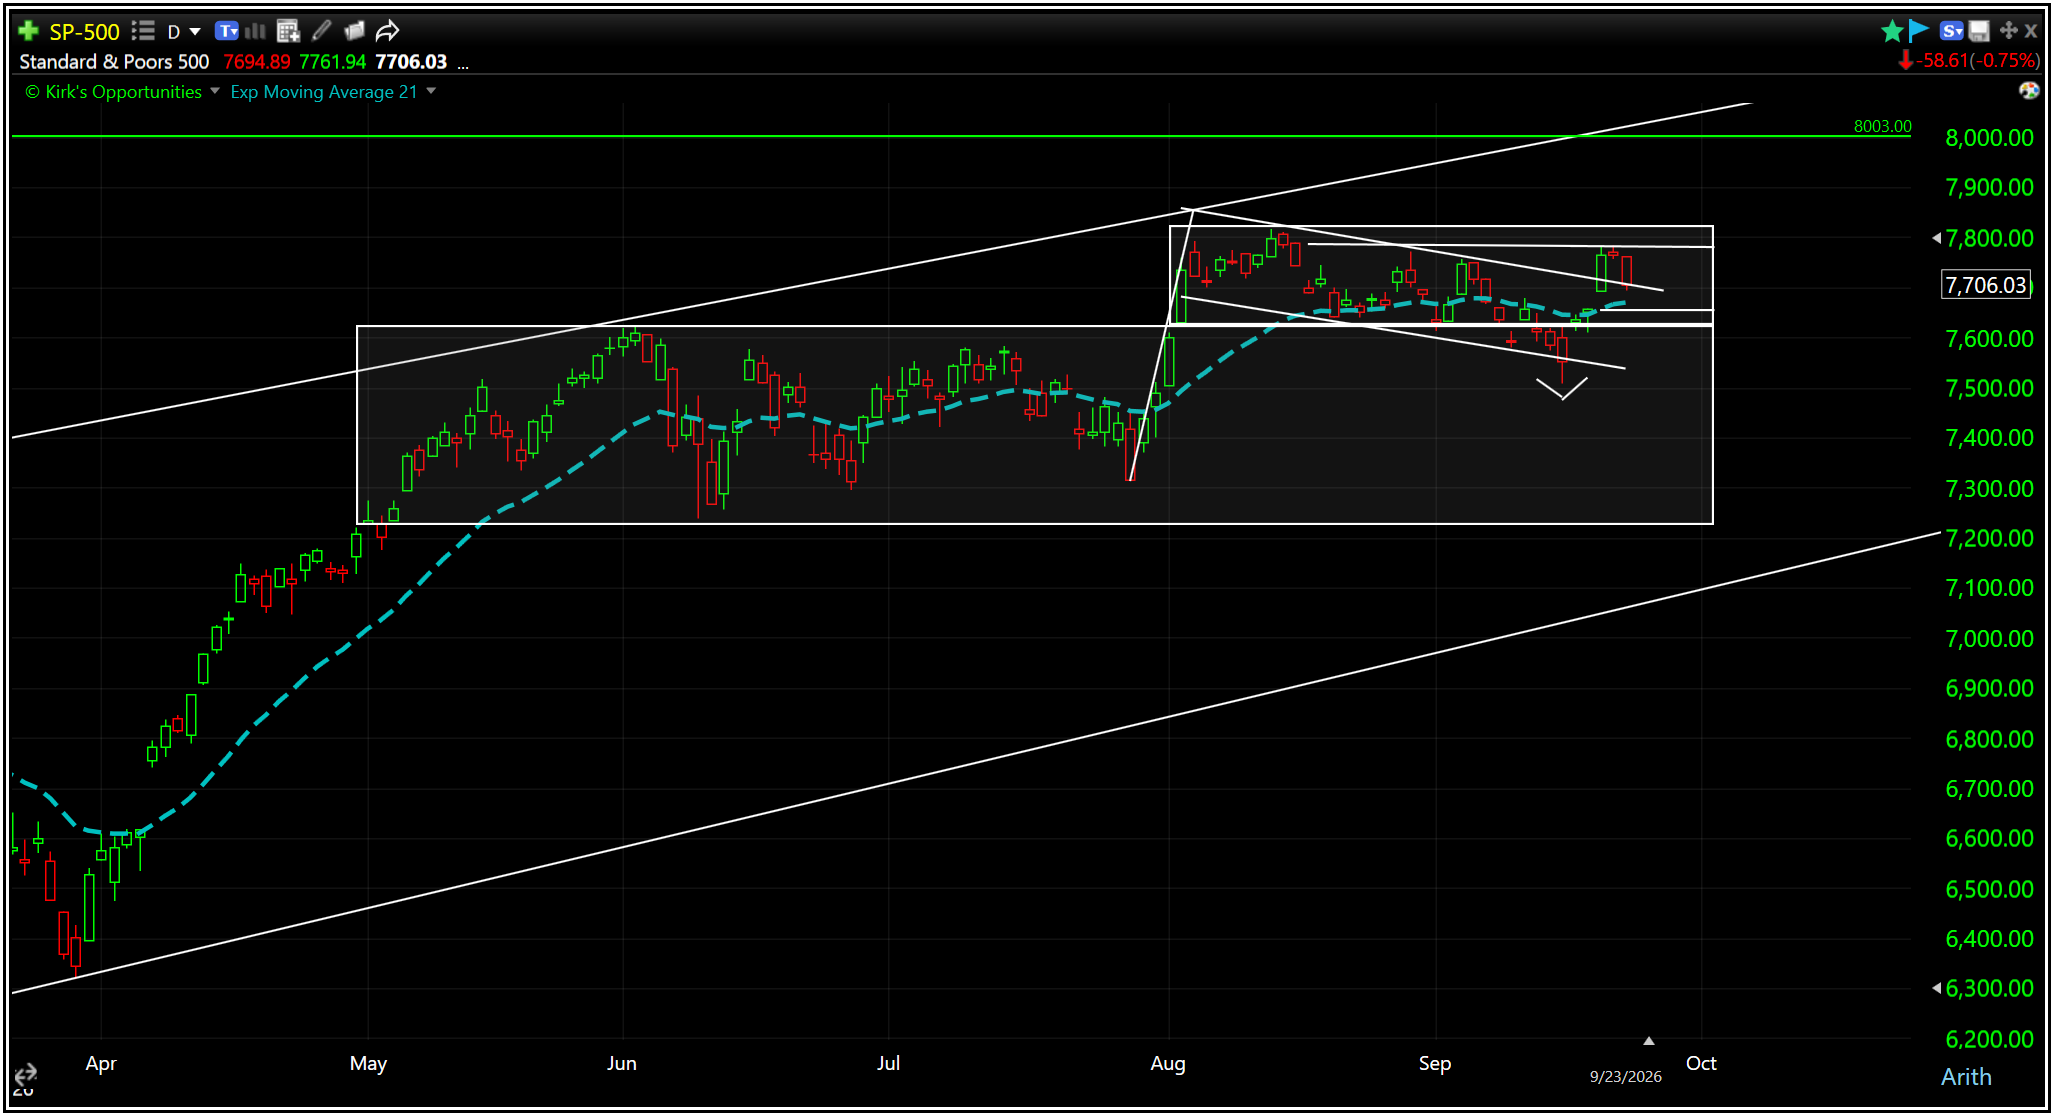
S&P 500: 7706.03: -0.75%.
Nasdaq 100: 30470.29: -0.85%.
Dow: 51511.59: -0.68%.
Russell 2000: 2838.66: -1.77%.
S&P MidCap 400: 3652.74: -0.61%.
The averages tell us stocks had a bad day.
For the S&P 500, a quick throwback to this week’s bull flag-like break.
Yet, as we’ve seen before, the major indexes don’t tell us nearly enough.
MONEY FLOW
Wednesday was a terrific example of why we don’t want to treat “the market” as one trade.
Selling was broad, with decliners overwhelming advancers, but beneath that pressure were pockets of remarkable relative strength.
Cybersecurity stood out immediately. Palo Alto Networks (PANW), CrowdStrike (CRWD) and Fortinet (FTNT) fought the tape. Software and technology names including VEEV, PLTR, NOW, WDAY, CRM and CDNS also showed relative strength. Energy names such as APA, DVN and COP benefited from renewed strength in crude.
Meanwhile, smaller companies were hit considerably harder, and several consumer-facing areas continued deteriorating.
The new-high/new-low list made the dispersion particularly easy to see.
New highs: ABBV, AMD, CRWD, DE, FFIV, FTNT.
New lows: AZO, LHX, STZ, LVS, WYNN, MCD, CCL, TMUS, NCLH, RCL.
Cybersecurity was showing up on one side.
Cruise lines and casinos were showing up on the other.
That’s dispersion.
And dispersion creates opportunities for active investors willing to look beneath the indexes.
Disclosure: I currently own CRWD and NET.
BENEATH THE SURFACE
The headline indexes remain relatively close to their highs.
A growing portion of the market isn’t behaving that way.
The breadth work we’ve been following shows the recent bounce becoming increasingly concentrated. Fewer stocks are carrying more of the load while participation underneath continues deteriorating.
Small caps reinforced the warning Wednesday.
The Russell 2000’s potential bear trap from Tuesday didn’t survive. Sellers regained control and pushed the index toward its 150-day moving average, an area it hasn’t tested since the March-April period.
The moving average itself isn’t magical.
What matters is that smaller stocks continue confirming weakness the large-cap averages are partially concealing.
Credit belongs in this conversation as well.
Junk Bonds (HYG) fell 0.72% Wednesday and made another 52-week low. That doesn’t signal a credit crisis, but it isn’t the confirmation we would want to see from credit while the major indexes remain relatively close to record levels.
Put another way:
The indexes haven’t cracked. Several things beneath them already have.
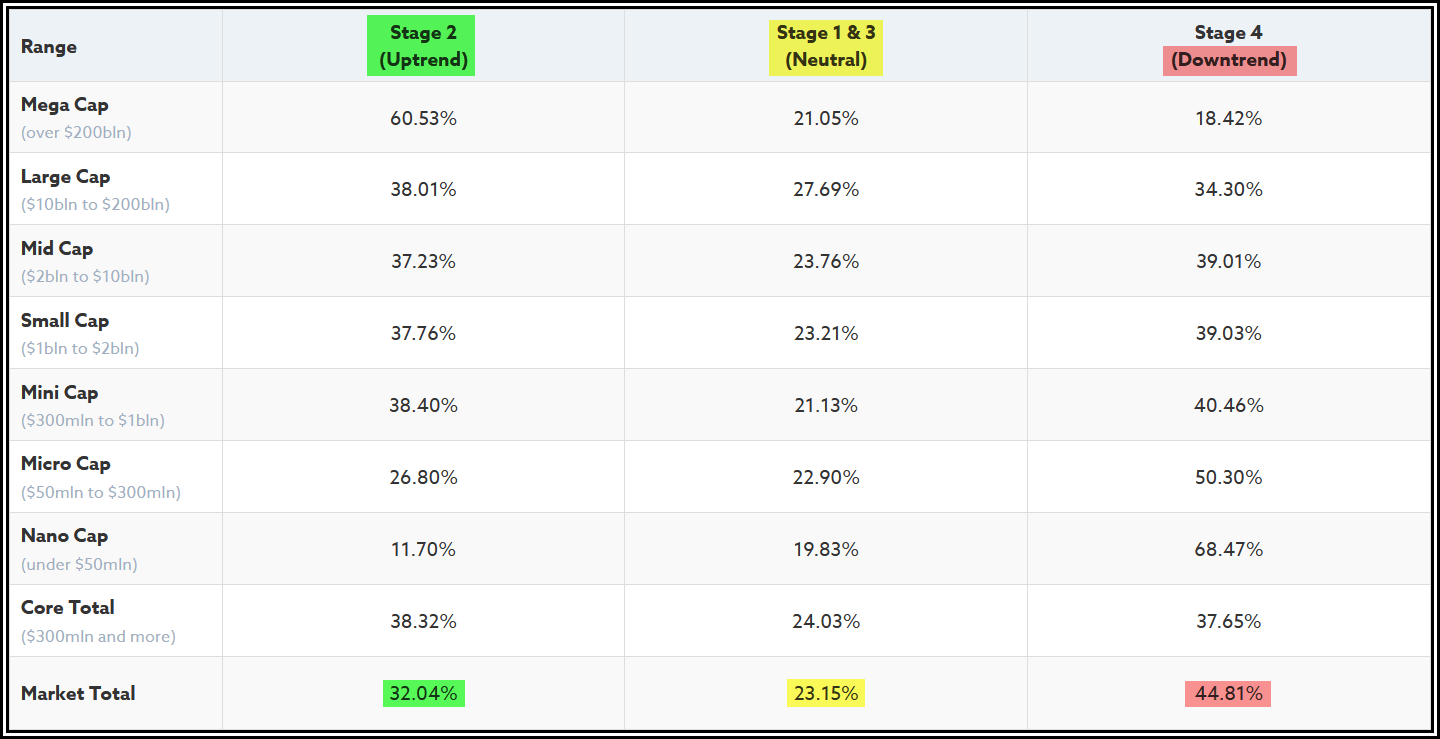
One way to see that is through stage analysis in which we are seeing more stocks move away from a stage 2 uptrend below the mega cap market cap.
THE MACRO CHAIN GETS TESTED
We’ve been using a simple framework:
Oil → Inflation → Fed → Yields → Valuations → Breadth → Price
Wednesday ran almost directly through it. Business activity remained strong, but input-price pressures also increased as fuel and transportation costs rose.
Strong economic activity itself isn’t bearish. The complication comes when resilient growth combines with renewed inflation pressure.
That gives the Fed less room.
Then oil moved back above $100. Fed expectations hardened. Treasury demand disappointed. And the 10-year pushed to 5.113%.
That’s the development we need to respect.
But there is another side.
The 10-year is now pressing into the third-deviation area on our chart. Previous trips this far from trend have not been sustainable for long.
That doesn’t guarantee yields reverse here. It tells us we’re approaching an important test.
If oil retreats, yields fall back below 5% and credit stabilizes, Wednesday could eventually look like another pressure extreme.
If those things don’t happen, equities may have considerably more adjusting to do.
Especially during this window of opportunity for the bears to take control.
After all, we are right in the middle of Fat Bear Week!

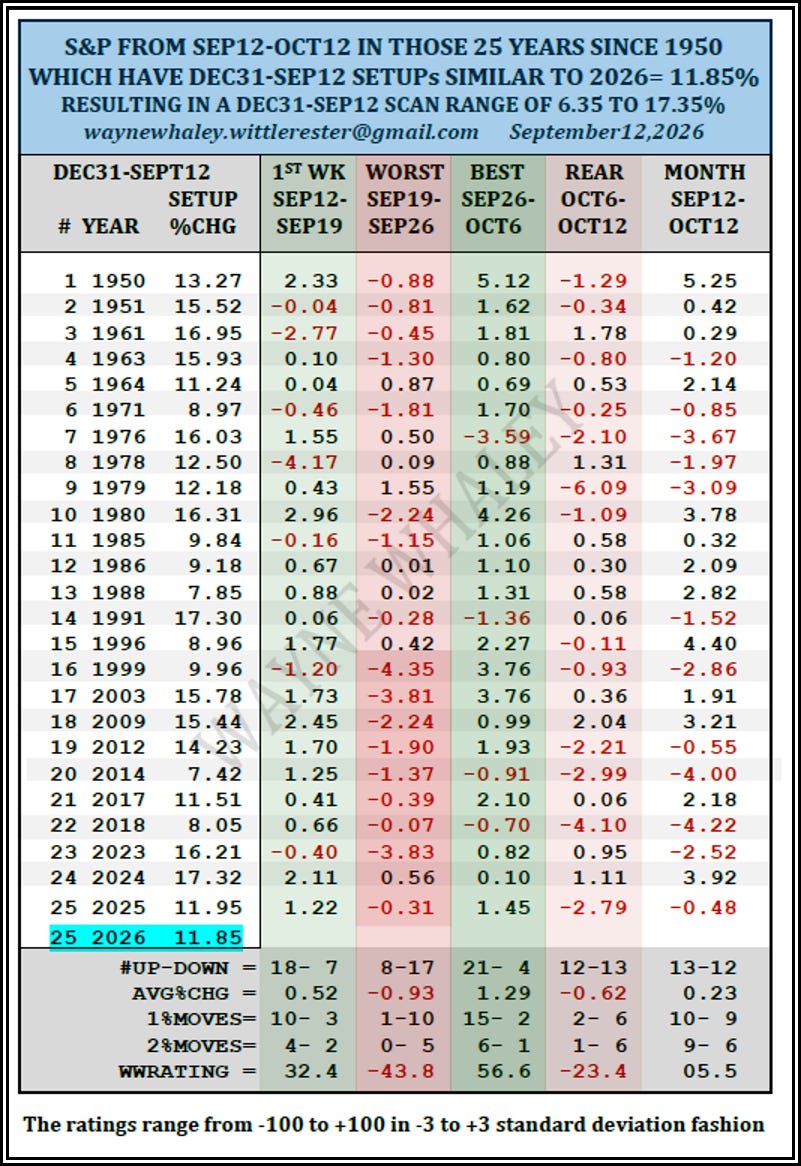
RISK DASHBOARD
Breadth: Deteriorating. The averages continue to conceal greater weakness underneath.
High-Yield Credit: Weakening. HYG made another 52-week low.
10-Year Yield: 5.113%. The most important near-term pressure point.
Oil: Brent back above $100. Renewed energy inflation feeds directly into the Fed/yield discussion.
Dollar: Strengthening, with a bullish reversal attempt worth monitoring.
Small Caps: Under pressure and testing deeper support.
Leadership: Narrow, but definitely not absent.
That last one matters.
WHO REFUSED TO GO DOWN?
Bad tapes can be excellent research tools.
When sellers are throwing almost everything overboard, we want to know which stocks investors simply refuse to give up.
Wednesday’s relative-strength list included:
PANW, CRWD, VEEV, APA, IR, PLTR, NTAP, ZBRA, FTNT, DVN, NOW, COP, WDAY, CDNS, ICE, CRM, CASY.
Several clusters stand out.
Cybersecurity: PANW, CRWD, FTNT.
Software/Technology: VEEV, PLTR, NOW, WDAY, CRM, CDNS, NTAP.
Energy: APA, DVN, COP.
This isn’t a buy list.
It’s a research list.
CRWD’s strength was especially welcome because it is already one of our existing positions. PANW and FTNT deserve further attention after refusing to follow the broader market lower.
Intel (INTC) also caught our attention.
It didn’t need to finish among Wednesday’s biggest winners. What mattered was how it traded intraday, absorbing selling pressure and showing signs of quiet accumulation while much of the market remained under pressure.
Observation first.
Action later.
MIXER
Quantum Gets Another Catalyst. Quantum stocks received another burst of attention around Quantum World Congress. IonQ (IONQ) said its next-generation systems will be the first installed at Nvidia’s new quantum research center, while Microsoft opened its technology to independent evaluators. The announcements add substance to a sector still dominated by expectations rather than commercial earnings, so the next test is whether conference excitement produces lasting business progress.
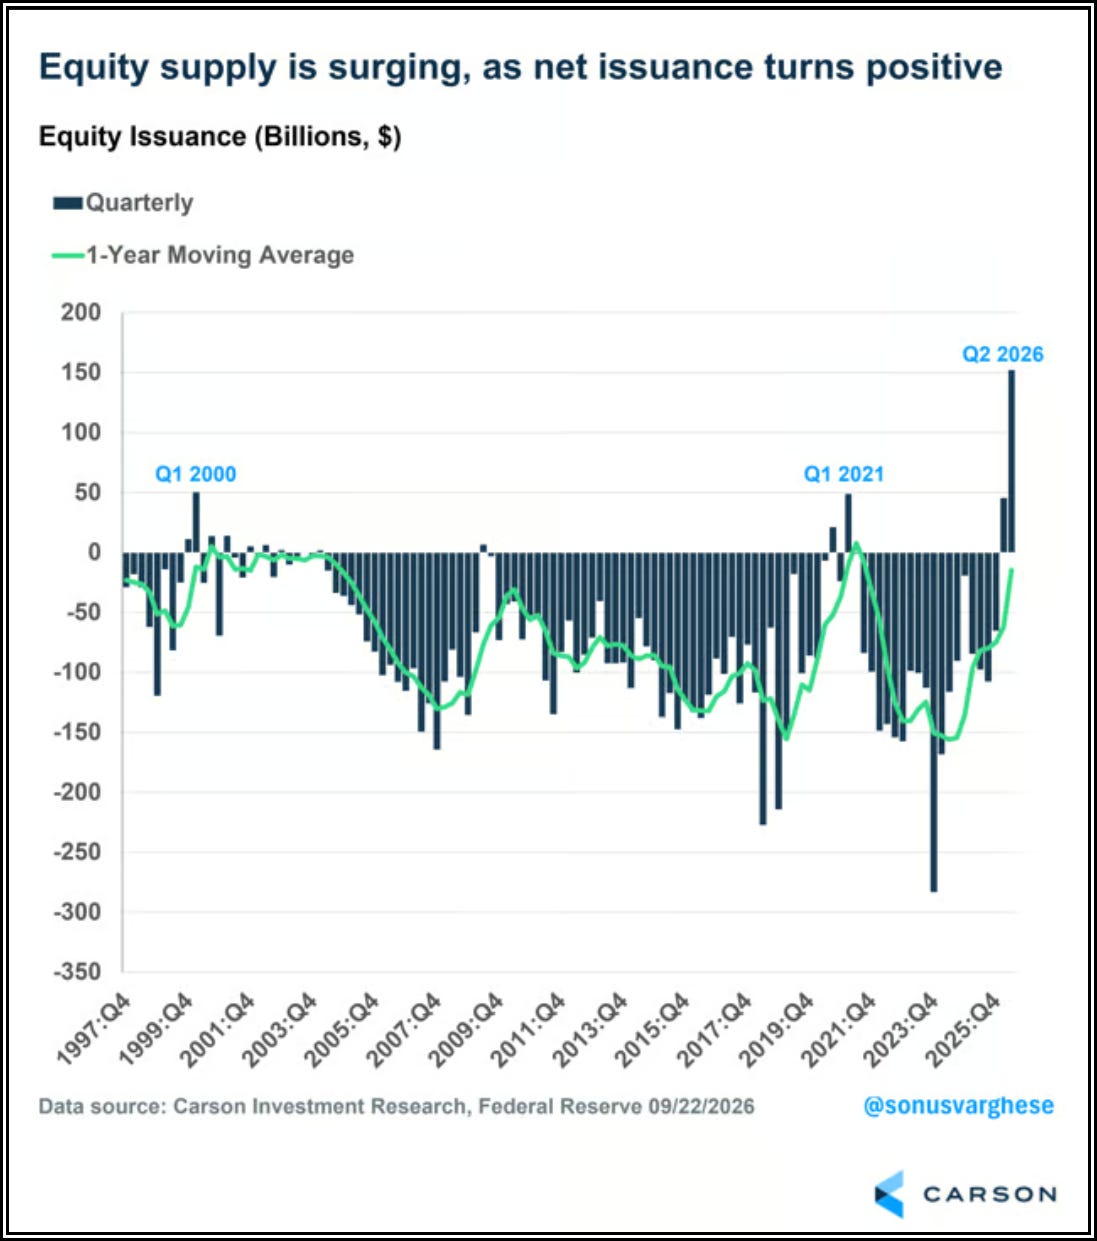
More Equity Supply Is Arriving. This chart shows net equity issuance turning sharply positive. More shares entering the market doesn’t automatically cause stocks to decline, but when marginal demand is already weakening, greater supply can make corrections move faster. Consider it another liquidity input rather than a standalone bearish signal.
Fuel Inflation Isn’t Just About What We Pay at the Pump. Rising diesel, heating-oil and transportation costs can work their way through supply chains and eventually into selling prices. That’s why oil has become more than an energy trade again. It sits near the beginning of the Oil → Inflation → Fed → Yields chain we’re monitoring.
Today in Markets History — LTCM. On this day in 1998, Wall Street’s largest investment banks completed a $3.65 billion rescue of Long-Term Capital Management after the hedge fund lost nearly $2 billion in one month. Sophisticated models, enormous leverage and positions assumed to be diversified proved considerably less independent once everybody needed liquidity at the same time. One of the many examples throughout history showing us that the people were thought they were smarter than the market turned out to have no clothes when the tide went out.
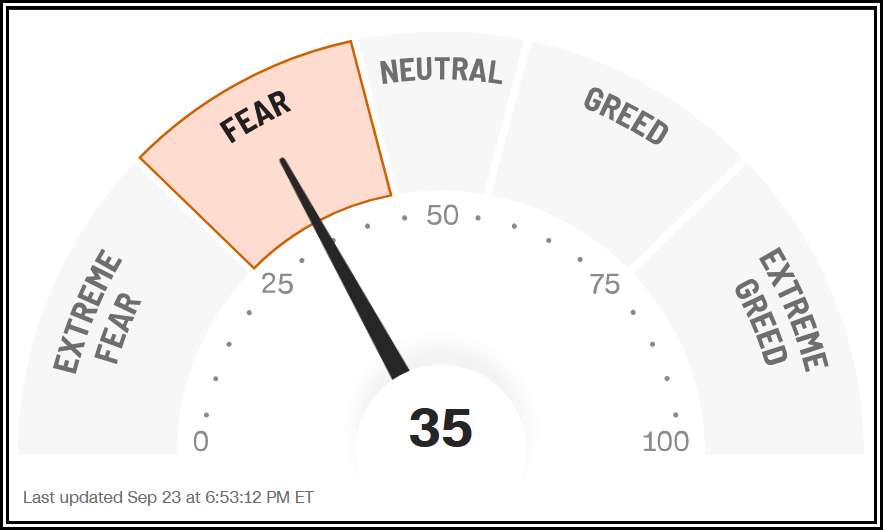
Time to be scared? Its that season once again where everyone tries to make you very afraid, especially pundits looking to hawk their books to feed upon your fears! This just in, in case you want to lose some extra hours of sleep tonight….
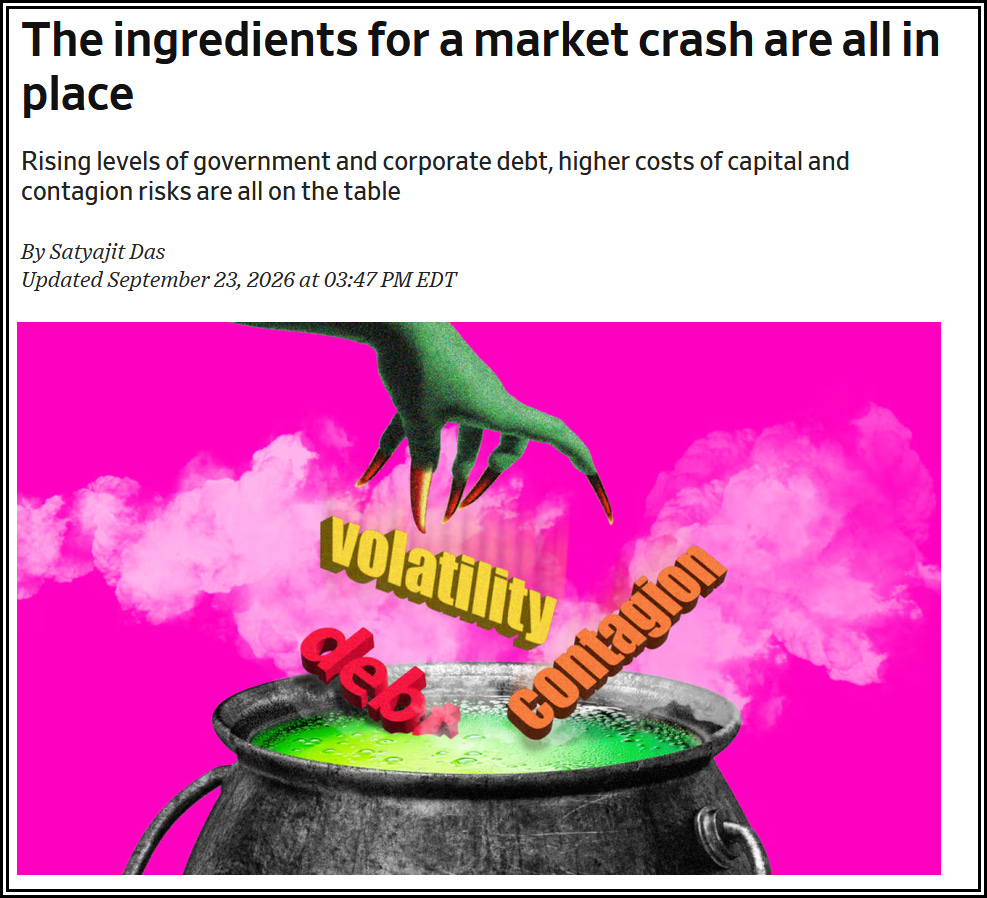
Satyajit Das argues that stretched valuations, $348 trillion in global debt, higher refinancing costs and links between banks, private credit and other investors leave markets vulnerable to a shock. He warns that forced selling could spread quickly while market liquidity and government support may prove inadequate. (MarketWatch)
MEMBERS ONLY
The market gave us warnings today—but it also surfaced a new opportunity worth digging into.
Below the paywall, I’m breaking down SK Hynix (SKHY), why it keeps appearing in my research, what stands out about its valuation and position in one of AI’s most important bottlenecks, and the bullish technical setup now developing on the chart.
Most importantly, we’ll look at the levels that could move SKHY from interesting to actionable—and what would tell us the setup isn’t ready.
Paid members continue below.
