


Buyers are attempting to take back control at these levels.
This is the bottom line message from what I saw out there today and tonight.
After capturing its short-term reversal target in the S&P 500 yesterday, another bullish double-bottom reversal play, similar to the reversal which formed on November 6th ahead of the last bounce, has taken shape.
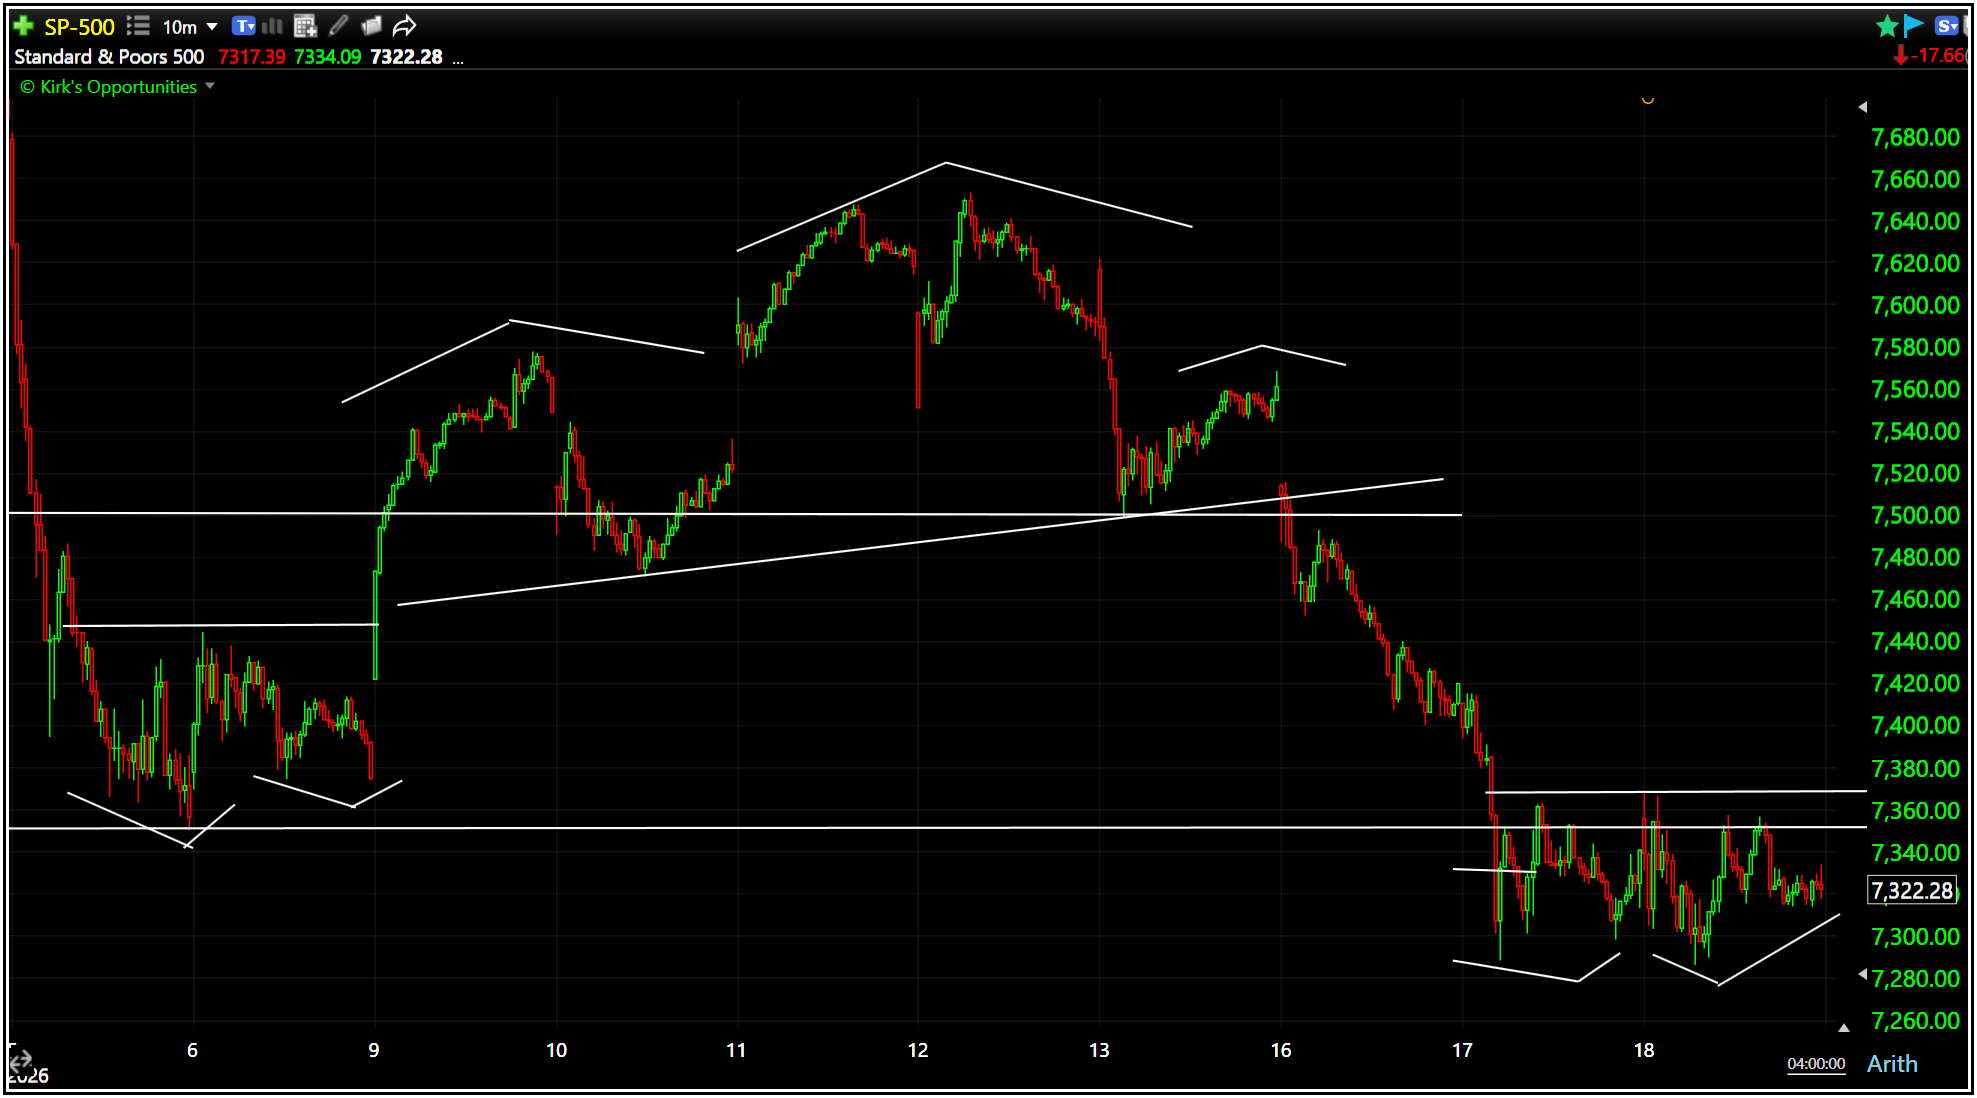
While the S&P 500 fell for a 5th straight day, its anchored VWAP which is slightly under its 200 day (not shown) continues to serve as a level of support that buyers are working with and attempt to take another stand to defend.
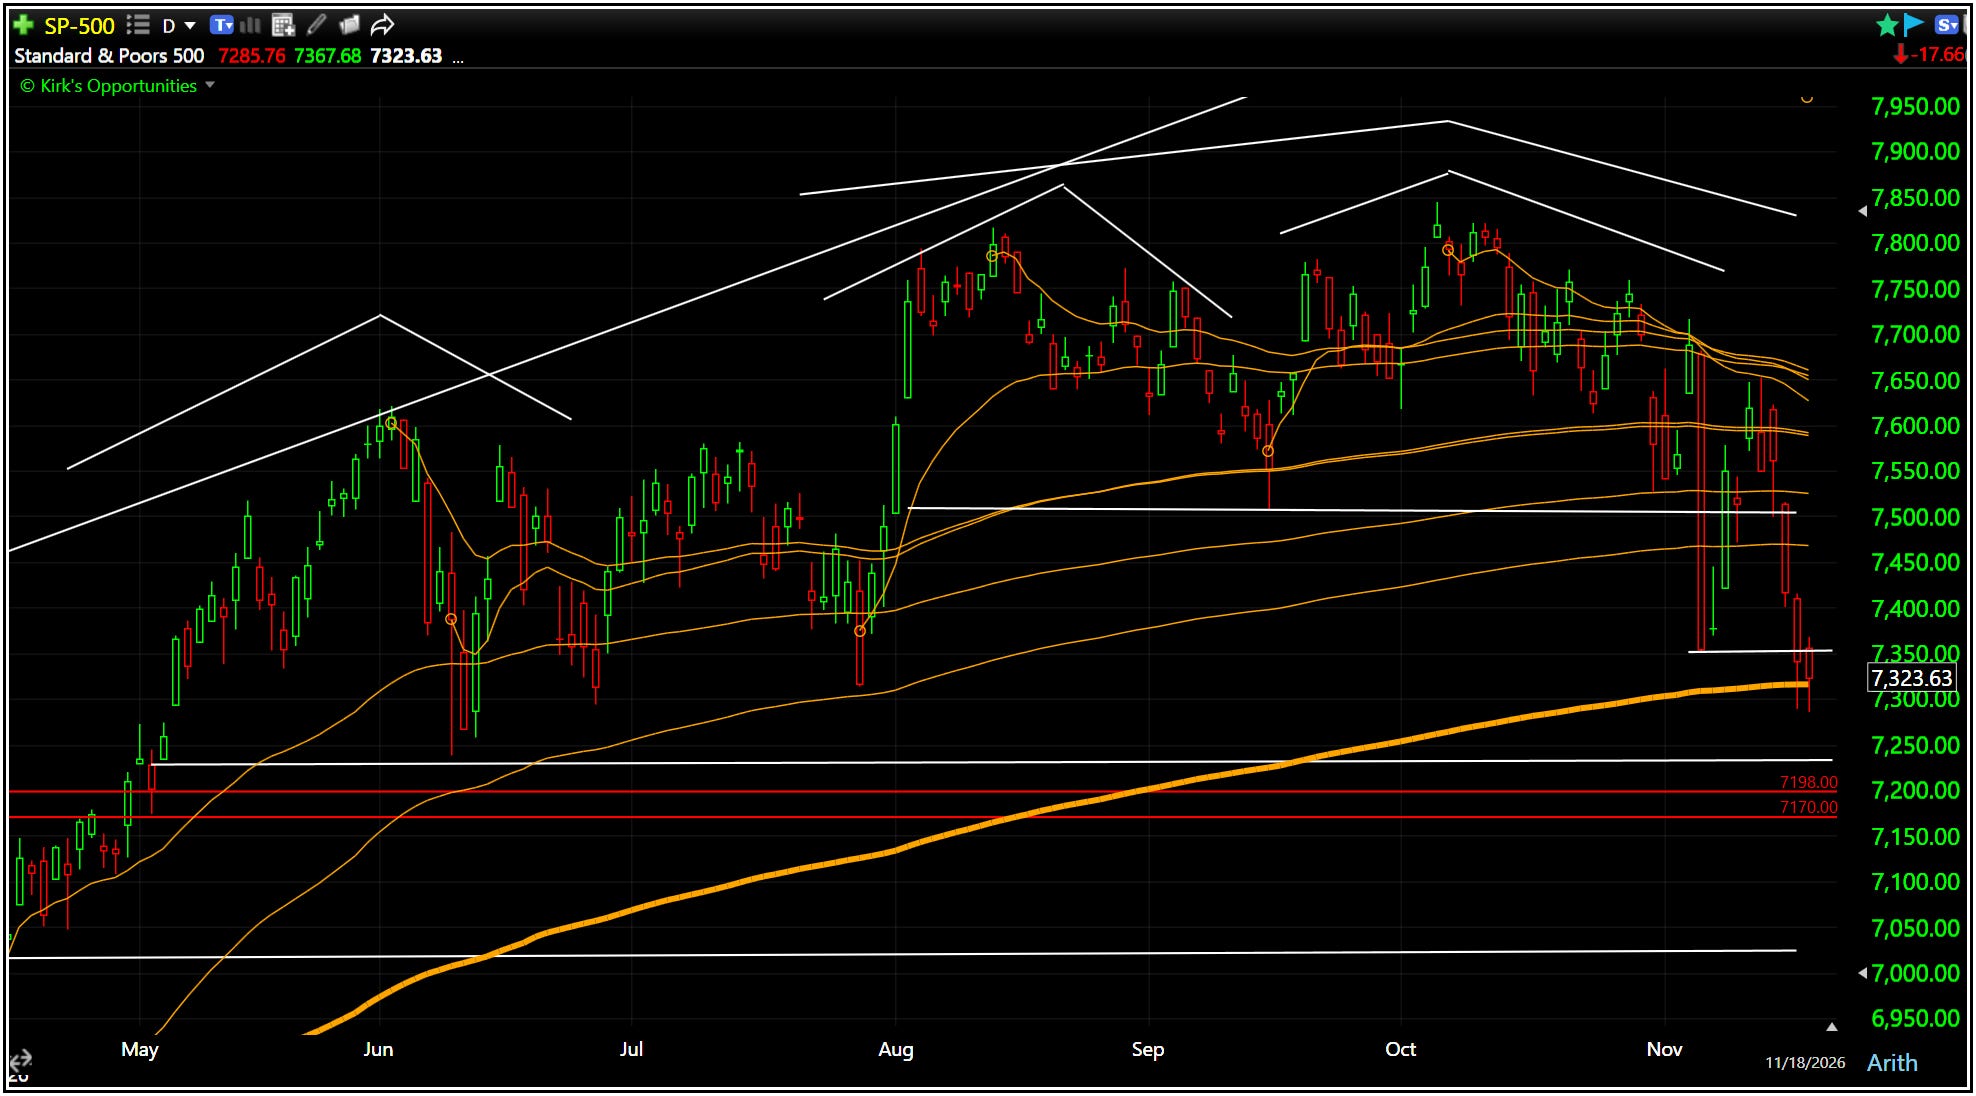
Unfortunately, the controlling bearish double-top reversal play targeting 7198-7170 remains confirmed and in motion. It will remain this way until that target zone is captured or there is a convincing move back above the S&P 7500-7507 area again.
In between here and there, is no man’s land awaiting further information.
In the Nasdaq 100 & its Composite, the price action was a little stronger than the S&P 500 not only holding above yesterday’s intraday low, but producing a positive day. And, in after hours trading this evening, the QQQs have climbed back above the infamous 660-666 level again, triggering its own double-bottom reversal play which formed during open hours.
A reversal we’ll be watching closely for follow or failure first thing tomorrow am.
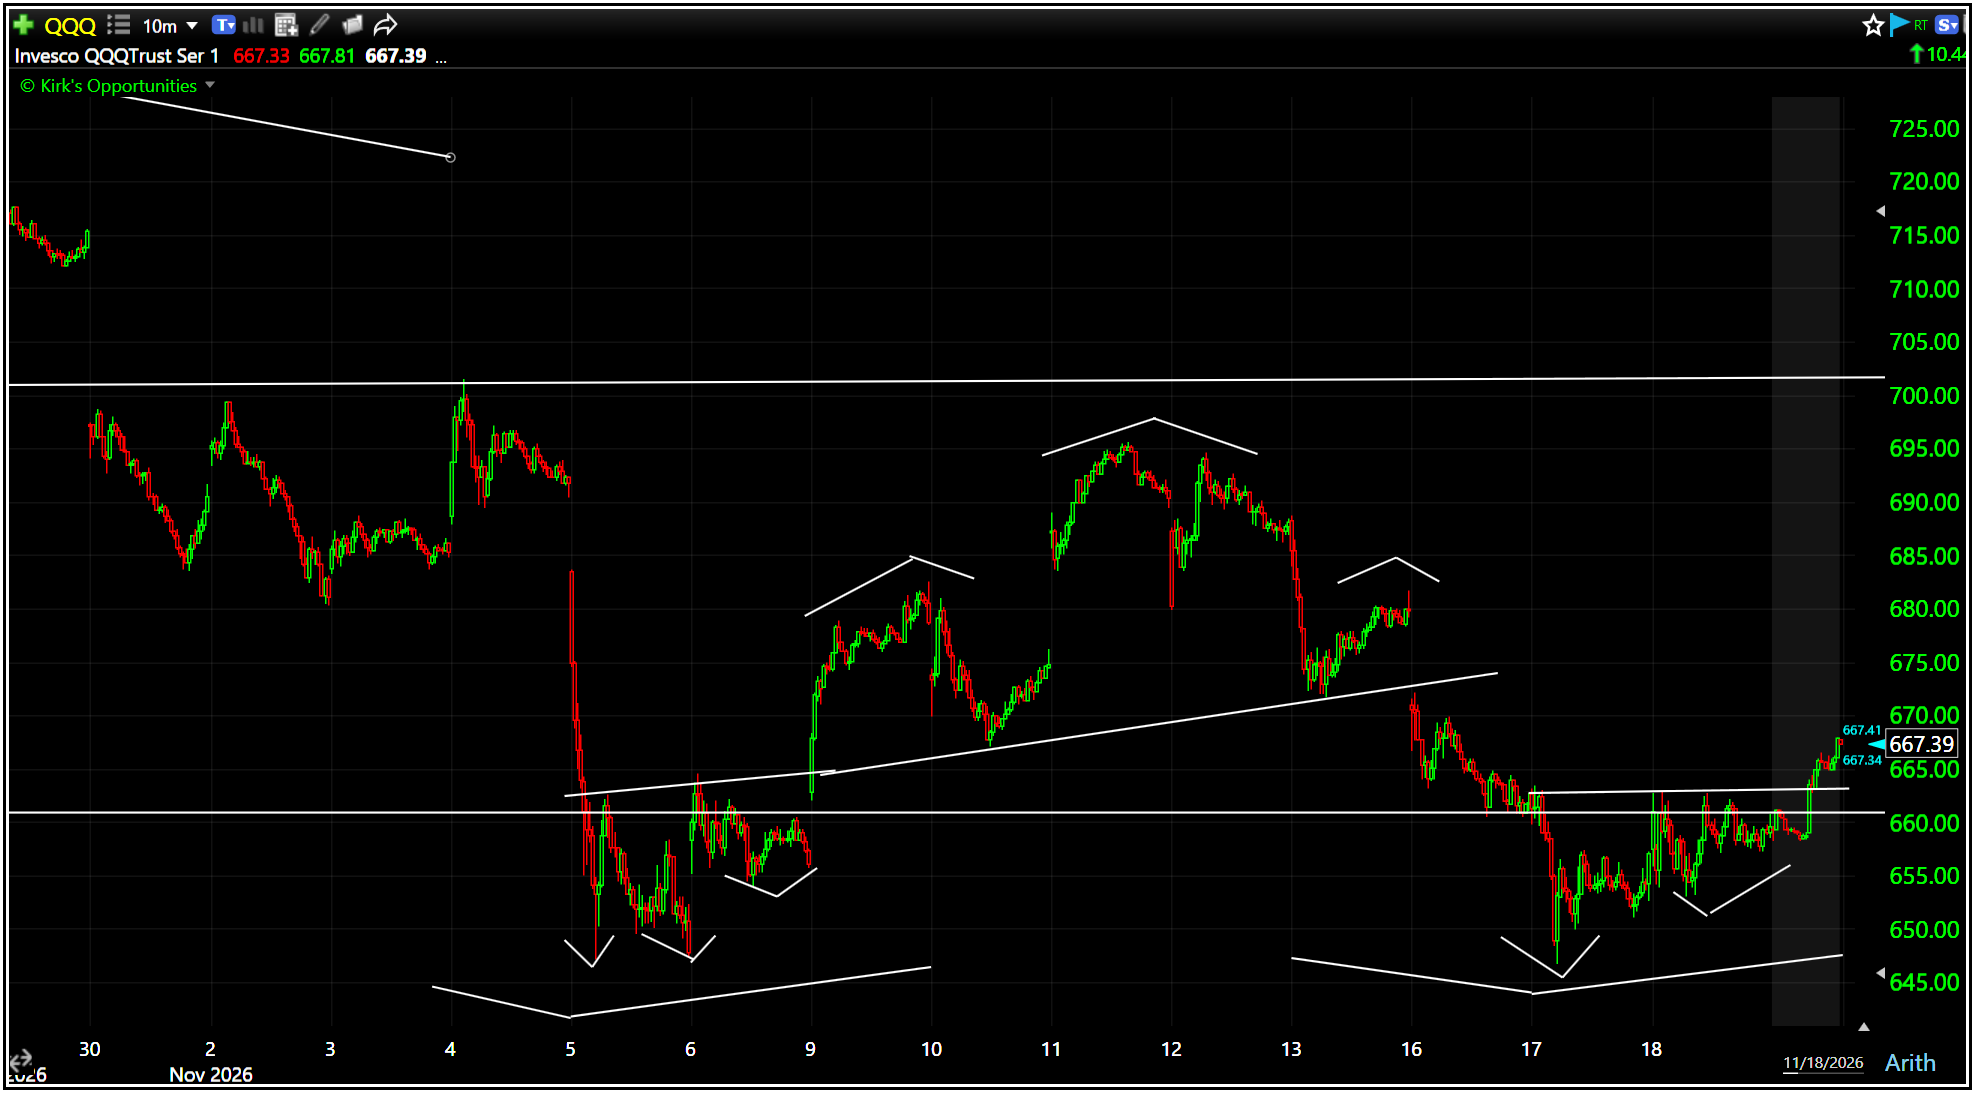
This may not look like much right now, but this 660-666 area is a significant level of interest and an area in which it makes sense for there to be a bear trap set.
The desire to trap the bears on failed breakdowns seems to be as strong as ever especially given that it has been the ideal setup for so long.
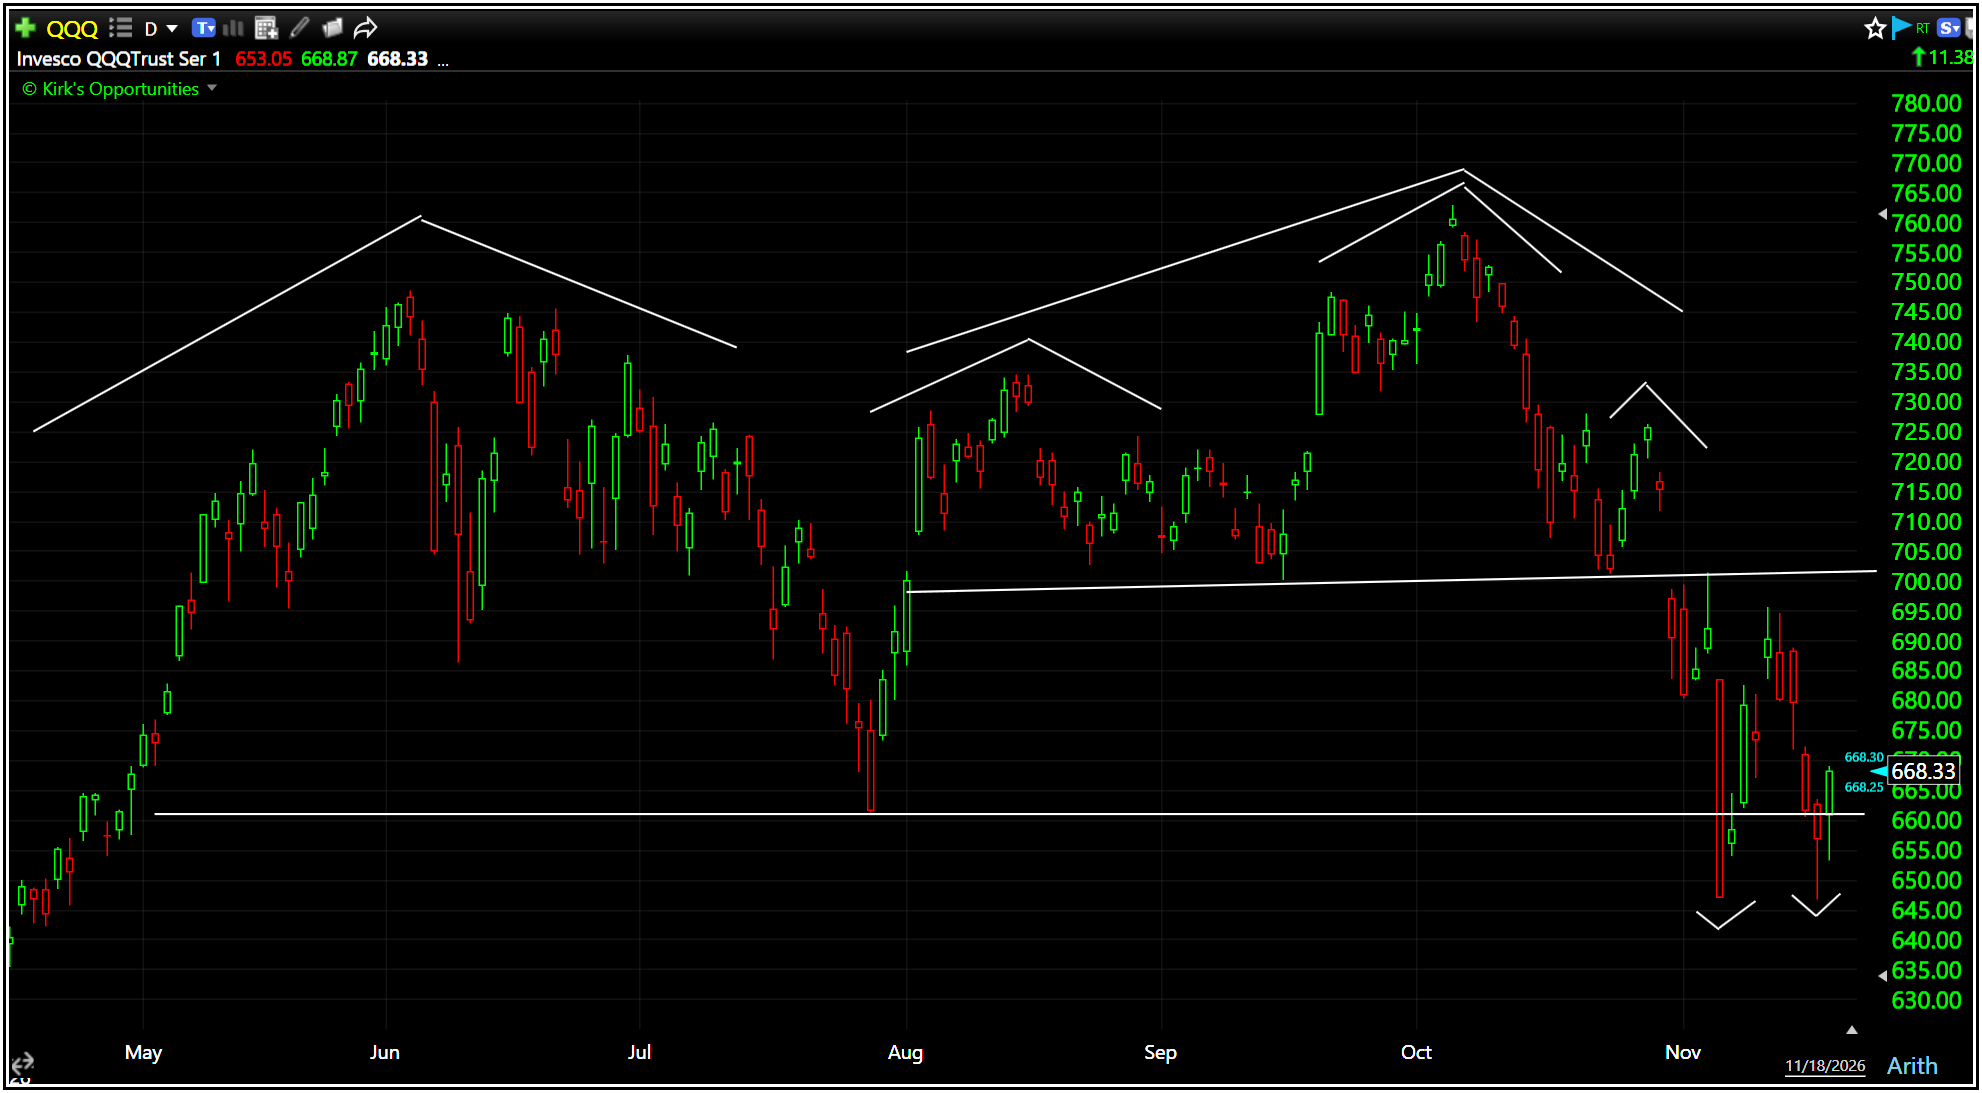
It may also be worth noting for those who may have noticed as well that all four major indexes have broken below their 200 day moving averages.
Widely considered longer-term, “do or die” level for the bulls. And an area where those who only buy in oversold markets under stress, start to put money to work again.
So, its either buy here and squeeze the sidelined and bears, or face the consequences, so to speak.
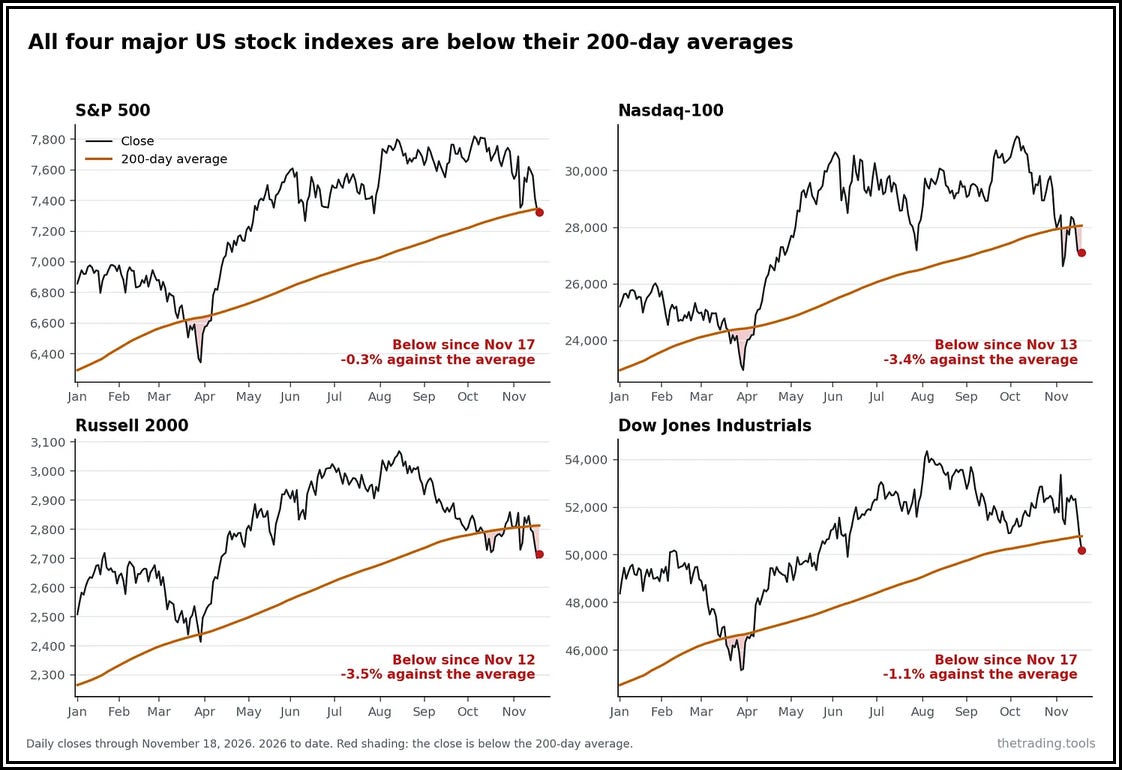
Historically, however, this 4 under 200 day event has occurred roughly once every 18 months and has NOT reliably distinguished ordinary corrections from major declines.
What matters more is how long the weakness persists.
When all four indexes remained below their 200-day averages for at least 10 of the first 21 trading sessions, the market experienced a median additional decline of approximately 6%, compared with just 2% when the breakdown was brief.
The lesson is simple: The initial breakdown is a warning sign, but persistent weakness is what deserves our greater attention.
The important question isn’t whether the market can bounce.
Of course it can!
The question is whether we’re beginning to see the conditions necessary for a recovery that investors can confidently build upon.
And in this regard, we are watching very closely!
