
Hello friends. I truly hope this finds you in a nice spot at home or out on vacation. :)
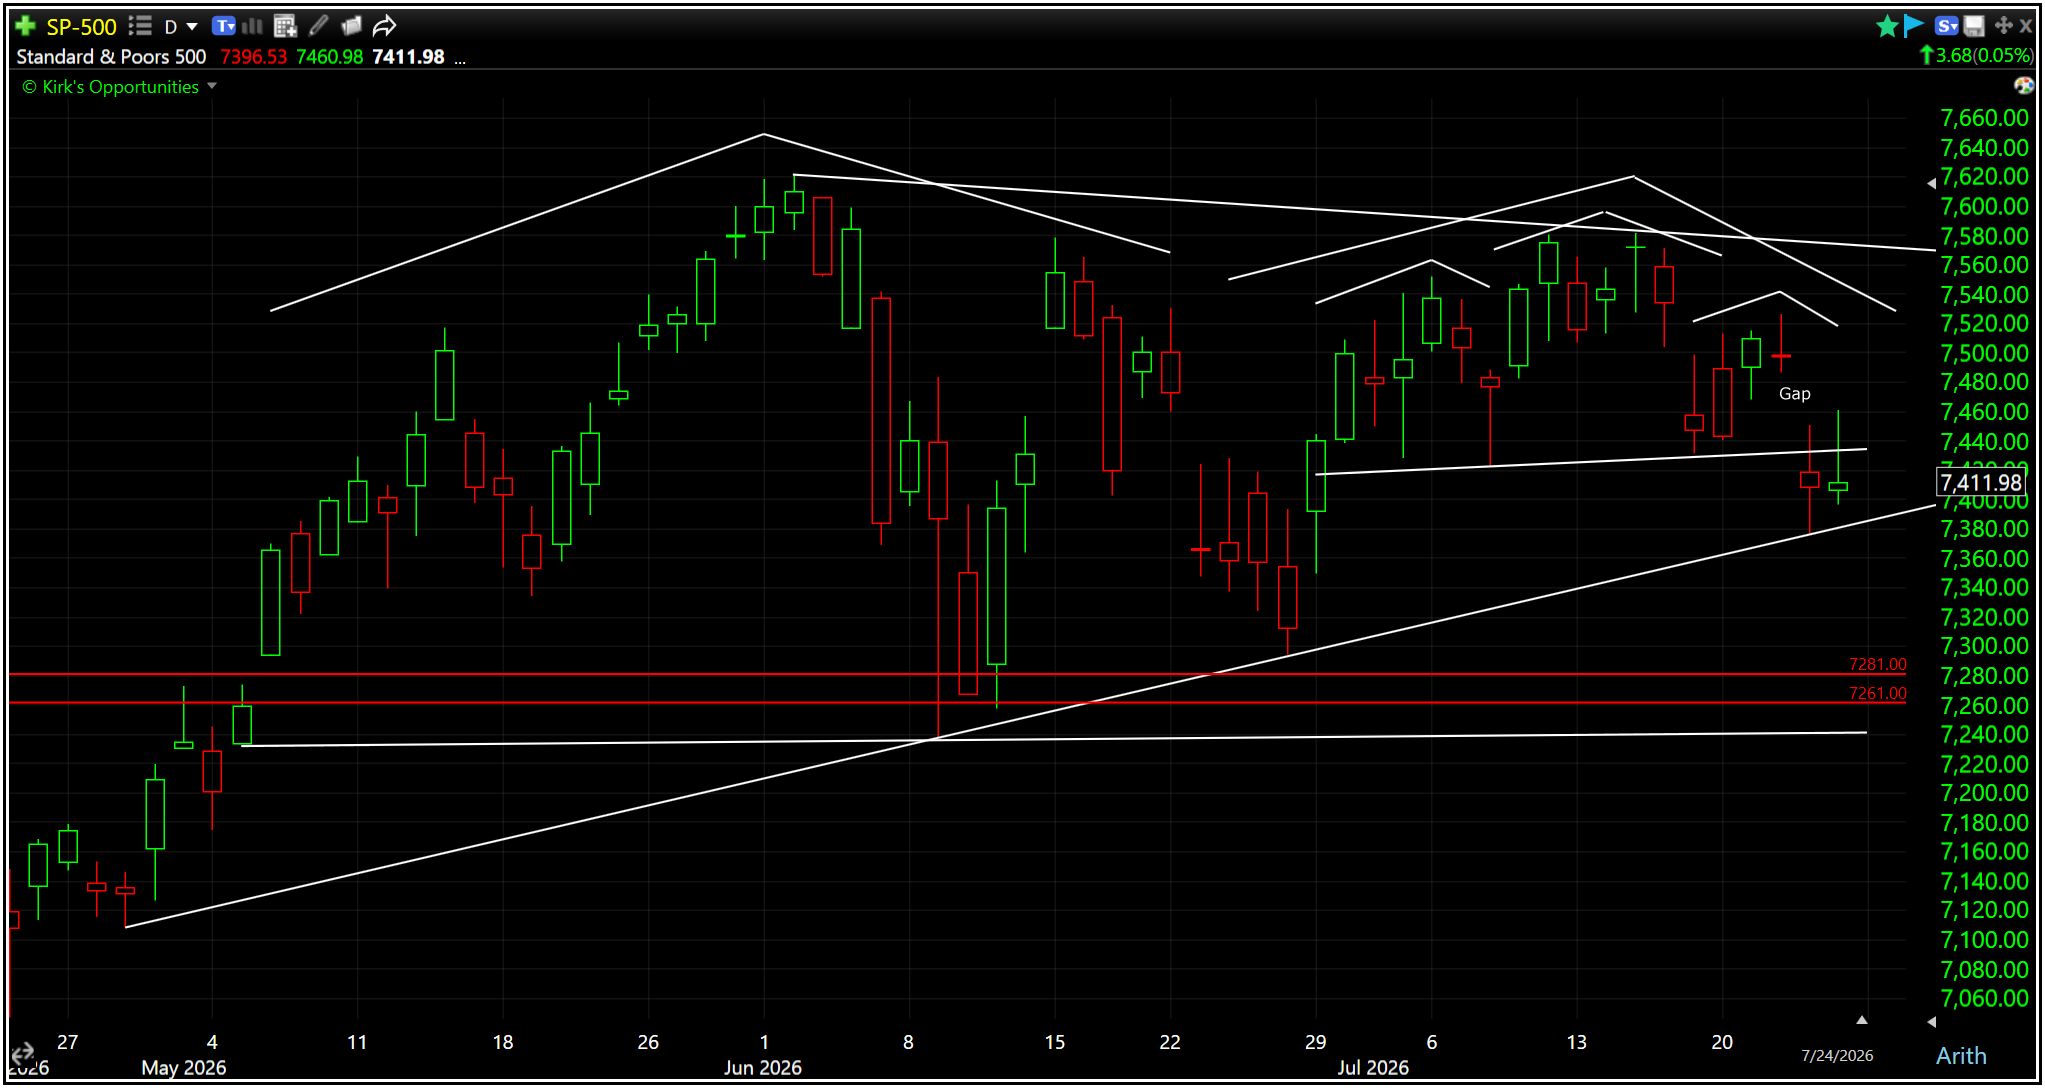
If you haven’t been paying much attention to the markets, there was a lot of drama last week, but not enough to break the major indexes free from their trading ranges.
Let’s review!
The Bottom Line
After the first two consecutive negative weeks since March, attempts to roll the market over further and break below the trading ranges were met with strong buying support.
The bears had their shot and failed to finish the job. Support held, and once the forced selling eased, buyers came back into the damage.
Forced liquidations in leveraged AI positions helped explain part of the sharp corrections in many of the first half’s top-performing stocks.
More importantly, sectors and stocks that had corrected significantly in July attracted buyers.
Concerns over rising yields, the Fed, and Iran-driven energy prices remained, but investors mostly looked past them as they positioned for the next stage of the AI cycle—one in which fundamentals will increasingly determine leaders and laggards.
Weekly Market Scorecard
The last week of July was a positive one for U.S. markets.
Nasdaq Composite: +1.6%
S&P 500: +1.1%
Dow: +1.0%
Nasdaq 100: +0.5%
Russell 2000: +0.05%
S&P Mid Cap 400: ‐0.7%
Stocks passed through a gauntlet of challenges.
The Federal Reserve remained focused on inflation. A major AI trade unwind hit heavily owned semiconductor and memory stocks. Apple and Meta received negative earnings reactions. Long-term Treasury yields moved higher.
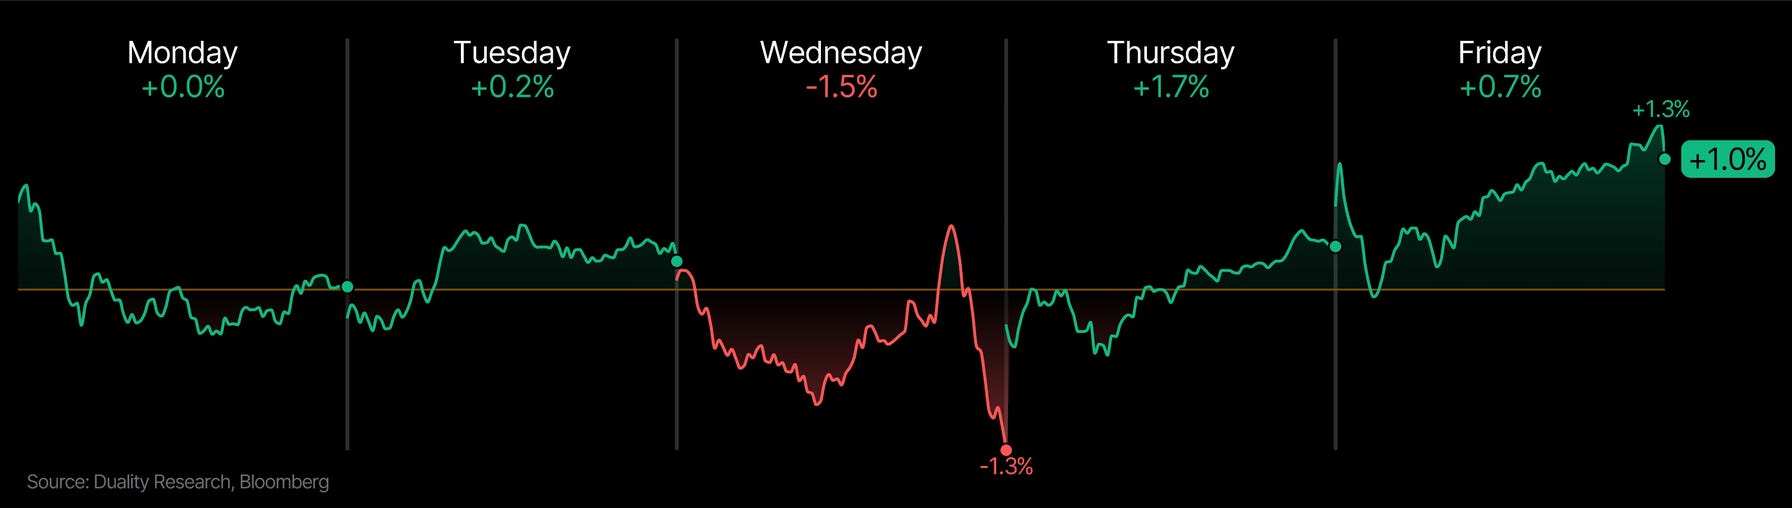
Despite all of that, every session except Wednesday finished higher.
More importantly, Wednesday’s post-Fed decline was aggressively bought. The bearish reversal patterns that formed and triggered during the prior week failed to deliver.
The failed breakdown was the important part. The market absorbed a Fed scare, higher yields, and forced selling without breaking the range.
How The Week Unfolded
Monday: Selling pressure continued across AI, semiconductor, and momentum stocks as investors remained cautious ahead of the Federal Reserve and major earnings.
Tuesday: The market attempted to stabilize, but leadership remained inconsistent and higher long-term Treasury yields continued limiting risk appetite.
Wednesday: The Federal Reserve held rates steady, but three dissents in favor of an increase and a firm inflation message triggered a sharp selloff.
Thursday: Microsoft’s results and a powerful semiconductor rebound produced the strongest session of the week, with the Nasdaq surging 2.8%.
Friday: Amazon, Alphabet, Microsoft, and Nvidia extended the recovery, overcoming Apple’s sharp decline and allowing the major indexes to finish higher for the week.
The Price Action
S&P 500: The Bearish Reversal Was Trapped
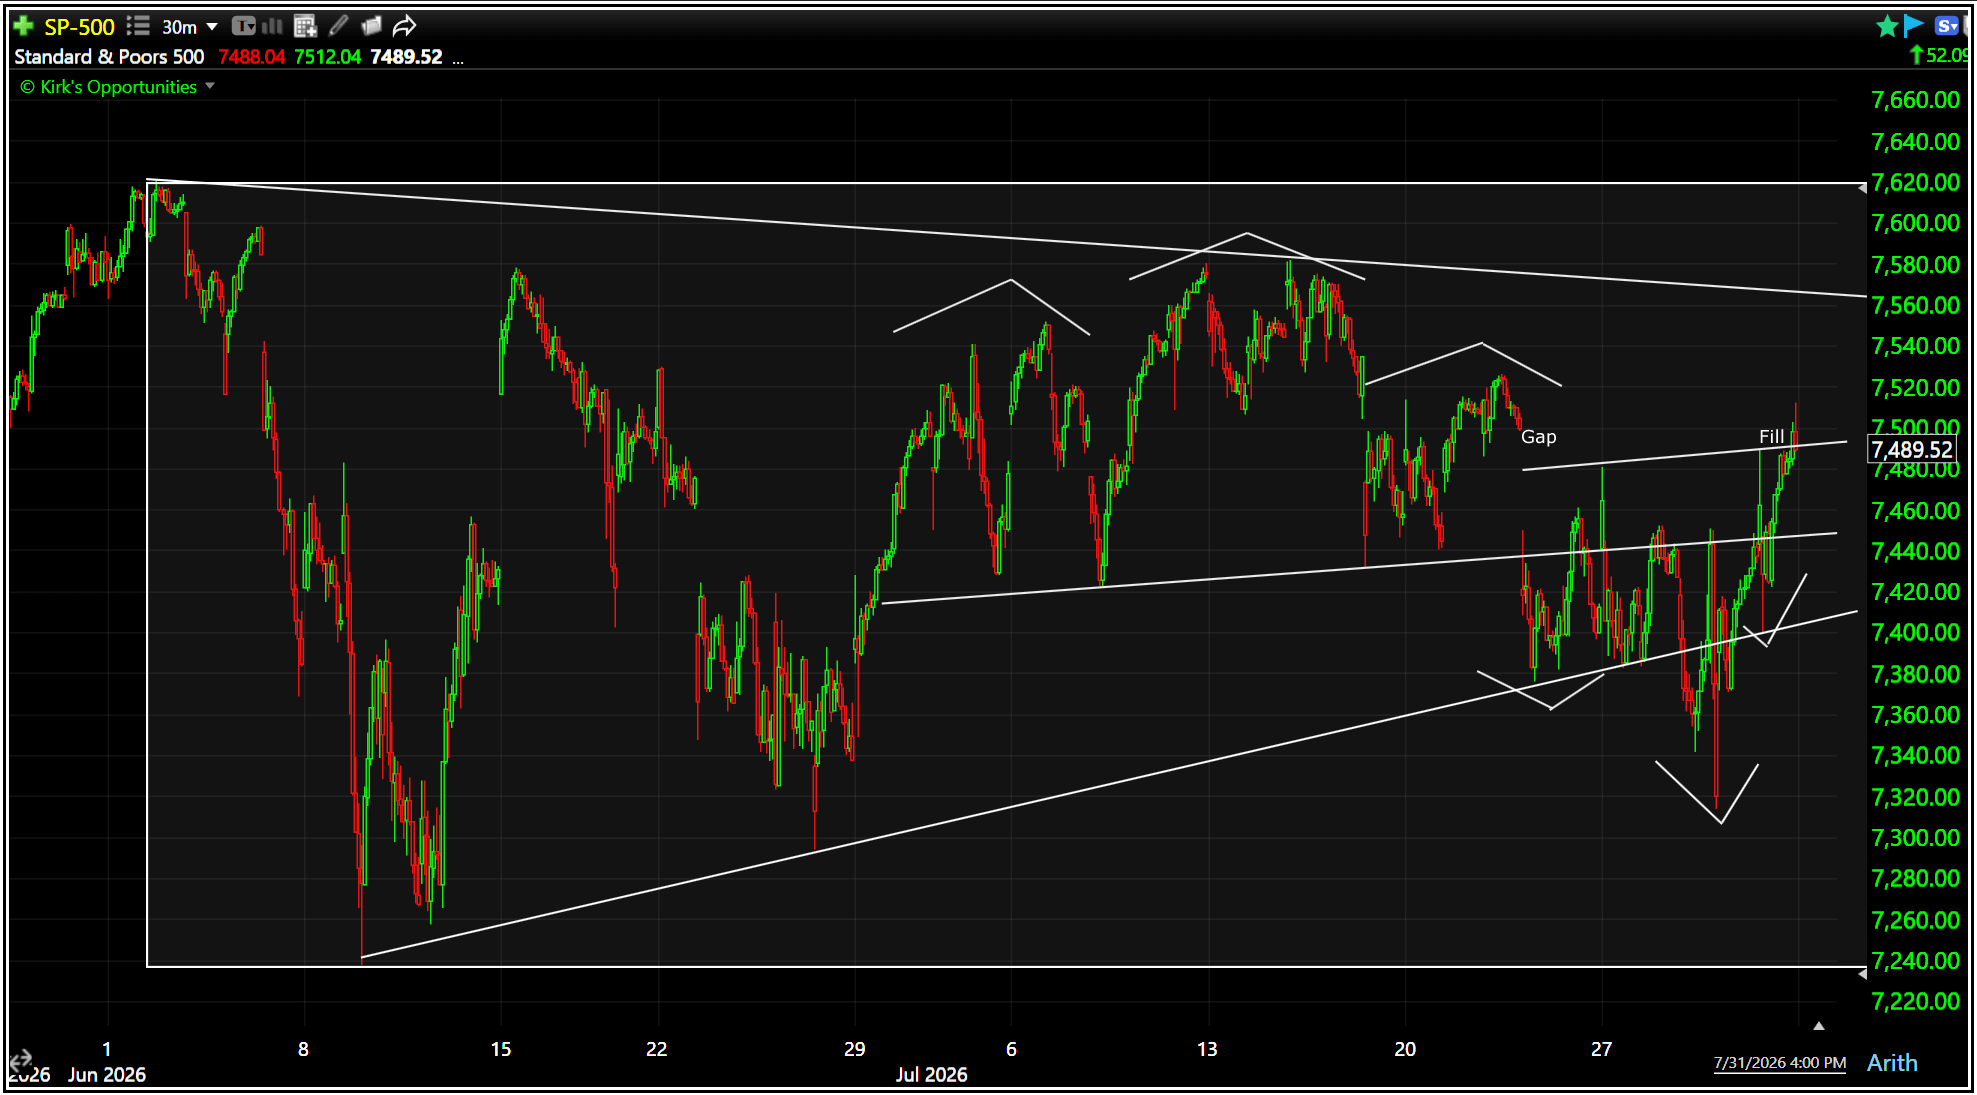
The prior short-term head-and-shoulders pattern failed to reach its downside targets at 7,281 and 7,261.
Had those targets been reached, the S&P 500 would have been positioned for another test of the June low and the bottom of its trading range.
Instead, the breakdown failed.
That trapped the bearish reversal and replaced it with a developing short-term bullish reversal targeting approximately 7,647 and 7,665, above the June 2 high at 7,620.
This does not guarantee those targets will be reached. The developing right shoulder may require more time and price construction.
What changed is the direction of the immediate opportunity.
Price is now positioned to challenge the top of the range rather than automatically retest the bottom.
We have seen several bullish and bearish patterns become trapped inside this range. That is normal. Trading ranges are designed to produce failed moves in both directions.
The priority remains a strong and sustained break from the range.
The S&P 500 remains beneath the June high, and the market still needs enough follow-through to overcome the repeated failures that have defined the past two months.
Trading Range Continues
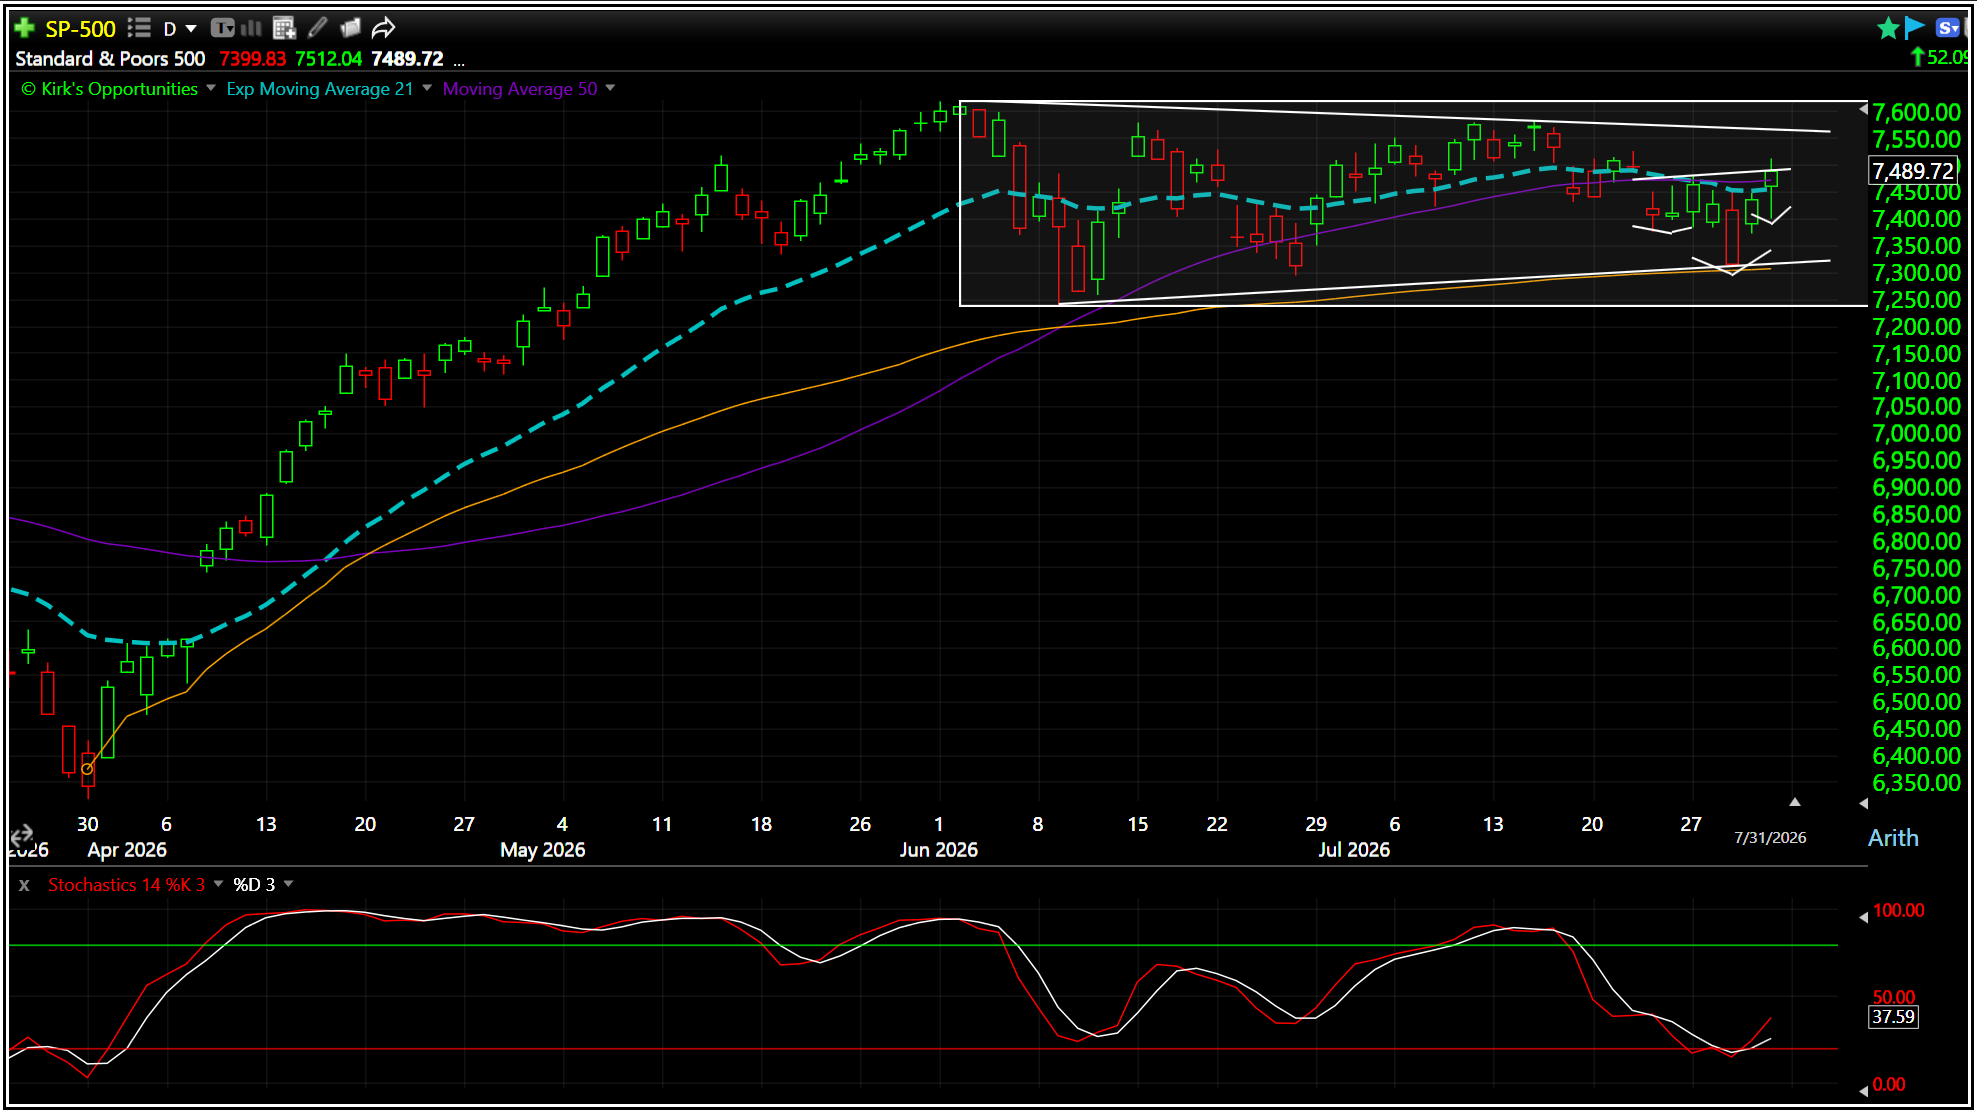
The S&P 500 rallied over +20% during a nine-week advance before spending the past eight weeks consolidating sideways in the range from the June high and low.
That consolidation finally generated oversold conditions last week for the first time since the end of March.
Price then tested the anchored VWAP from the March 30 low and recovered both its 21-day exponential moving average and 50-day moving average.
That is encouraging.
A strong and sustained move above the range would be better.
For investors whose fortunes are tied primarily to the major indexes, the pain has been more about individual stocks and sector exposure than sustained index losses.
The S&P 500’s early June drawdown was -5%, but many former leaders experienced much deeper corrections beneath the surface.
S&P 500 Levels
8,003: Range breakout target
7,620: June 2 high and primary resistance
7,581: Prior swing high and July high
7,500: Psychological round-number pivot (bullish above, bearish below)
7,489: July closing price
7,471: 50-day moving average
7,455: 21-day exponential moving average
7,307: AVWAP from the March low
7,237: June low and primary support
6,854: Range breakdown target
A move through 7,500 would improve the near-term picture, but 7,620 remains the level that would confirm a meaningful upside breakout.
A move below 7,237 would say buyers had lost control of the range.
Everything between those levels remains part of the consolidation.
Nasdaq 100
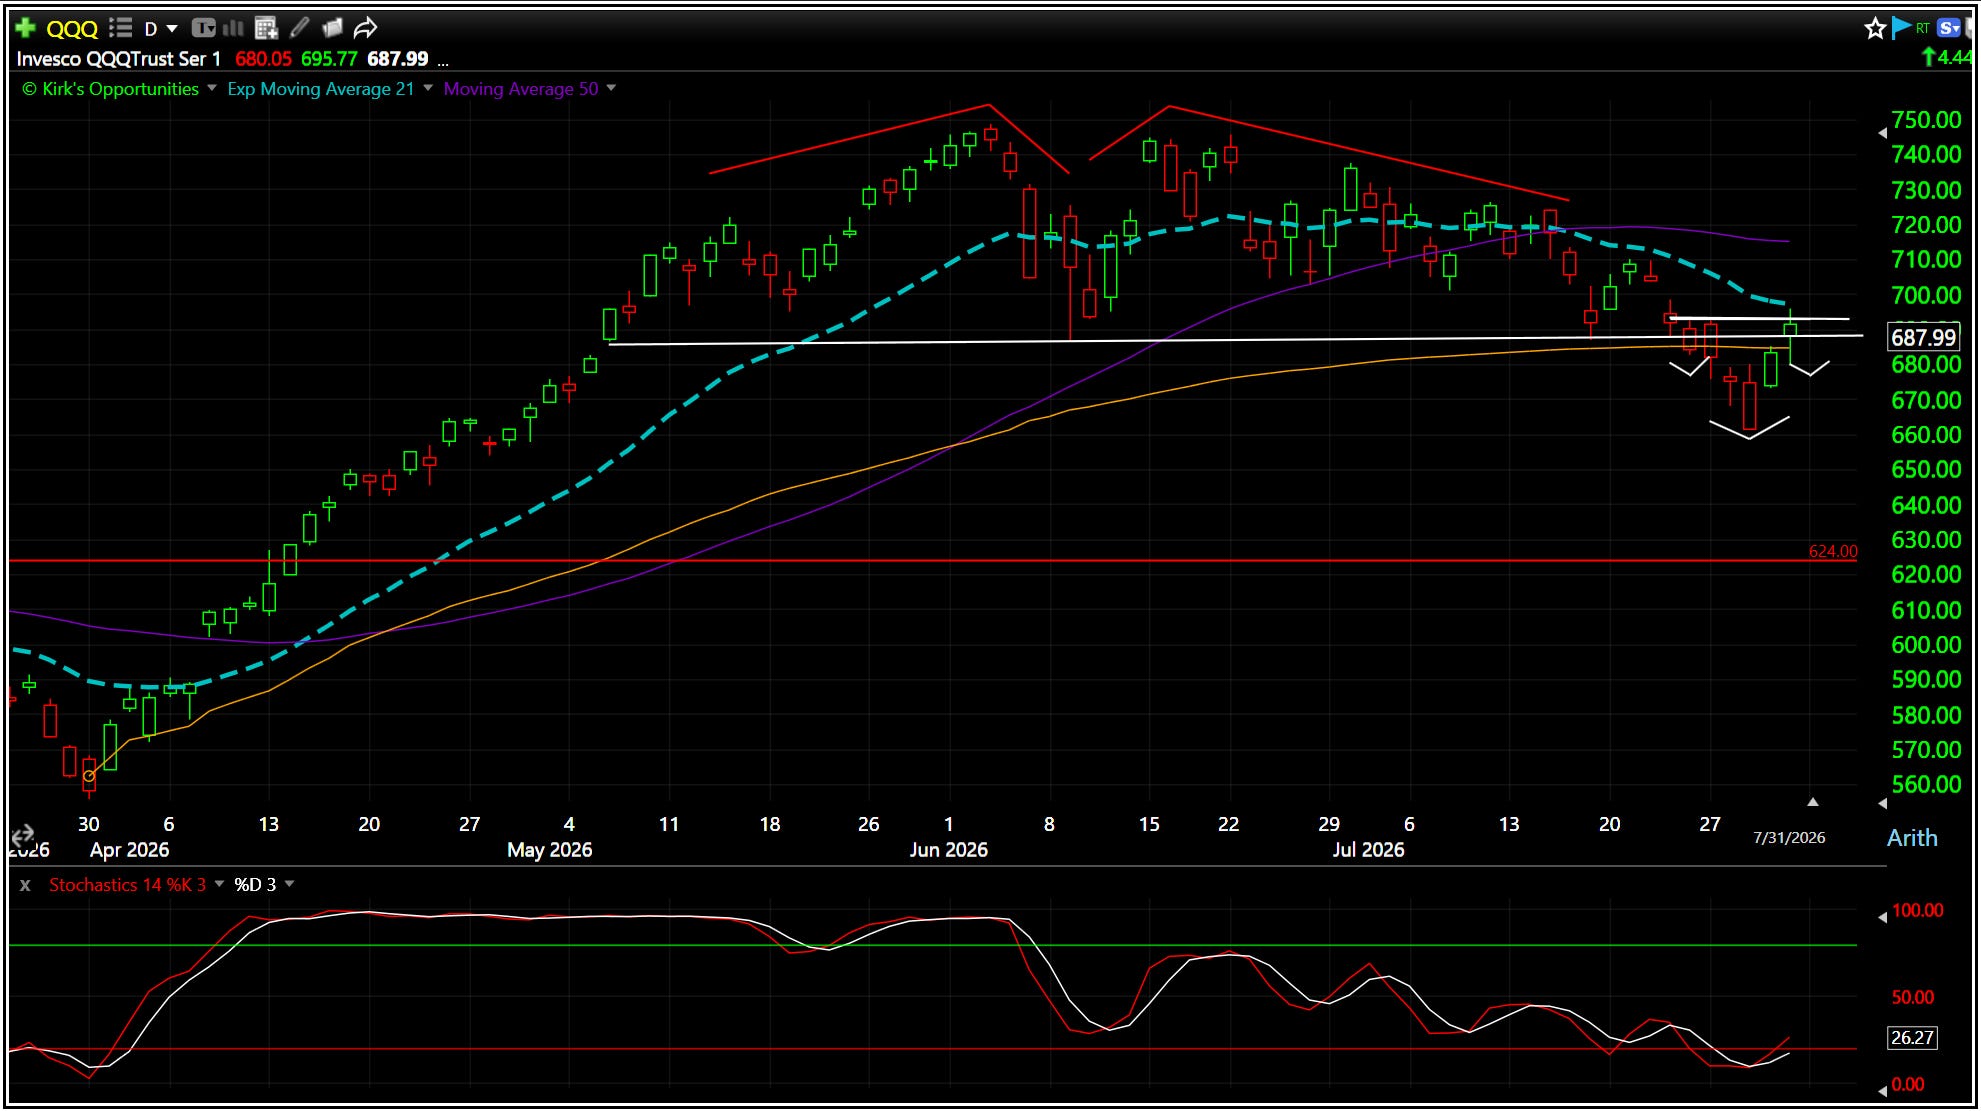
The Nasdaq 100 corrected -11% from its June high after gaining +35% during the preceding two-month advance.
Seen in that context, the correction itself was not unusual.
The more important development was that the apparent double-top breakdown also became a bear trap. The Nasdaq 100 rebounded from a six-day losing streak and recovered its June low.
That gives buyers something to work with, but the index still needs to reclaim its declining short-term moving averages and begin forming higher lows.
Midcaps & Small Caps
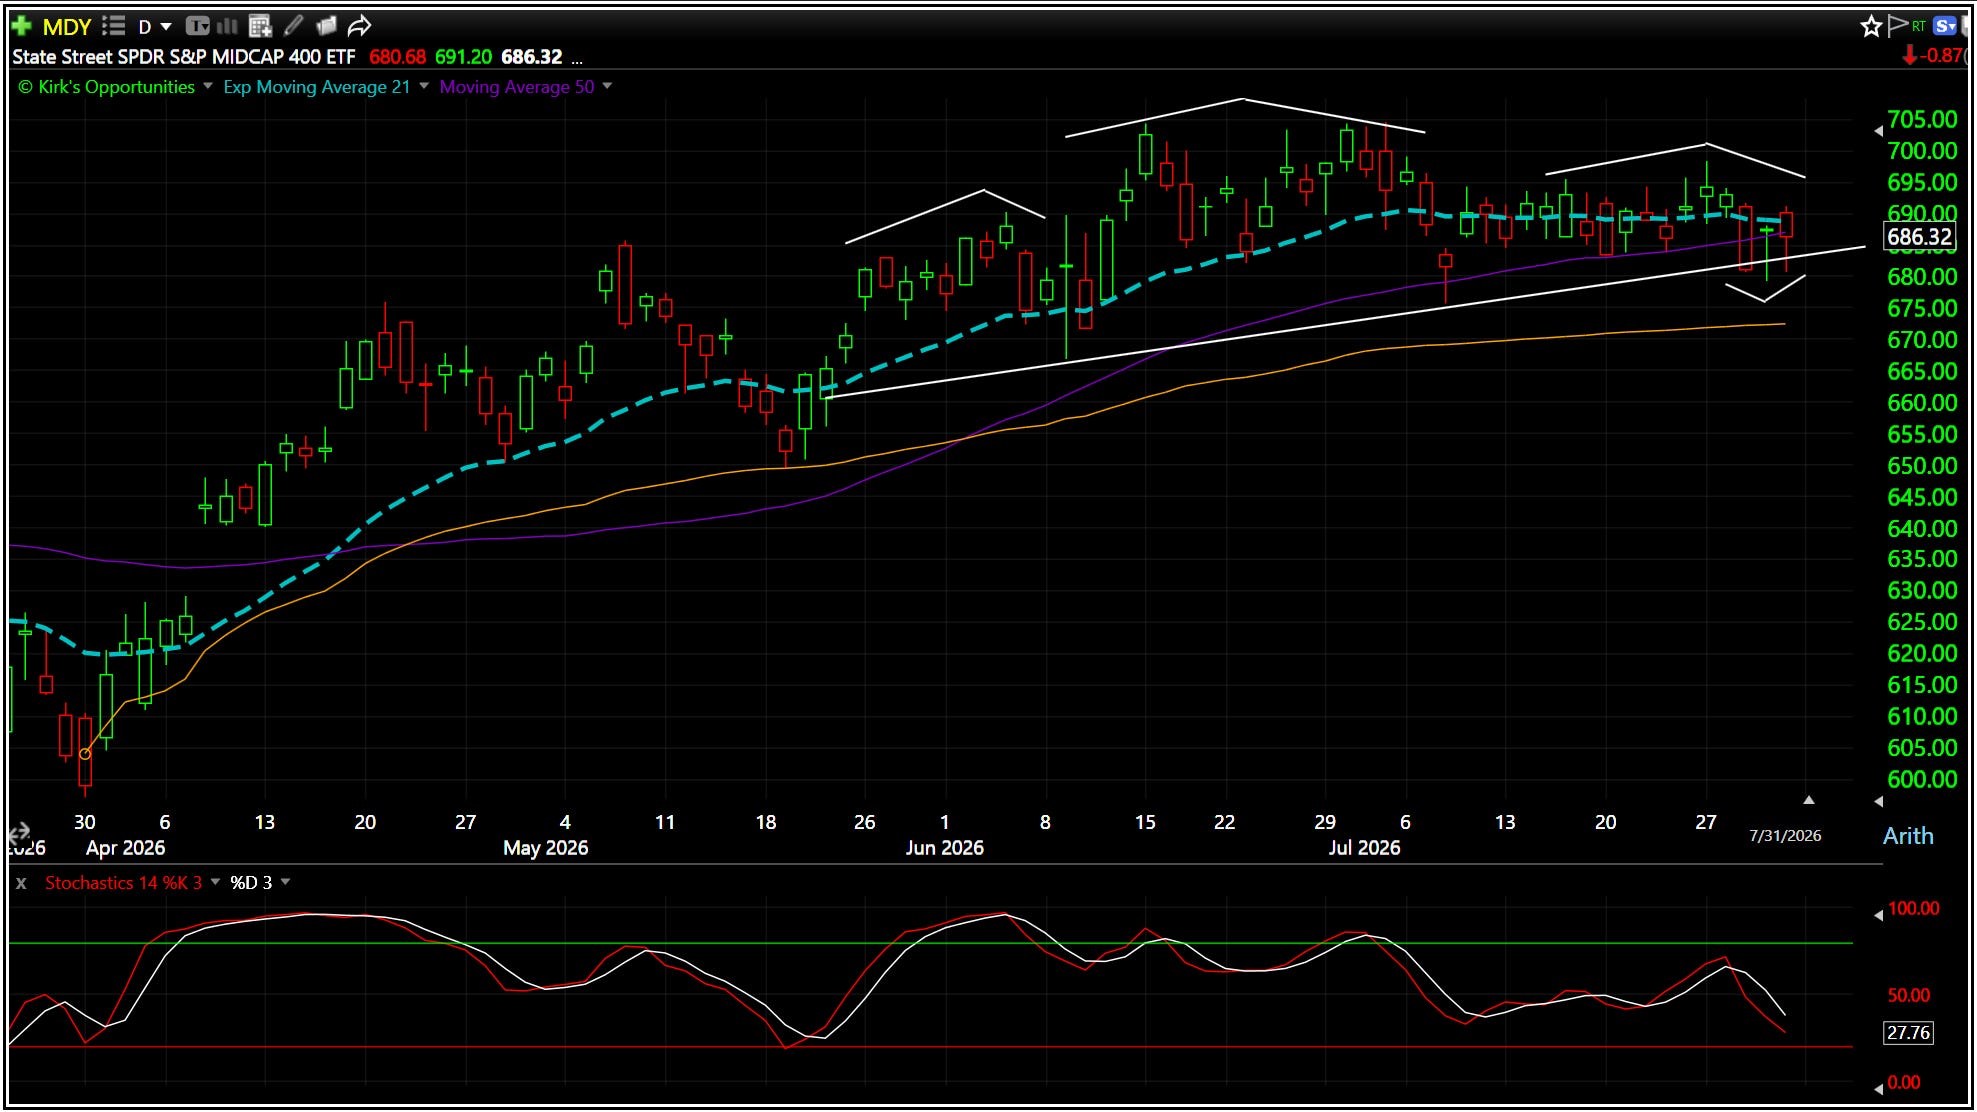
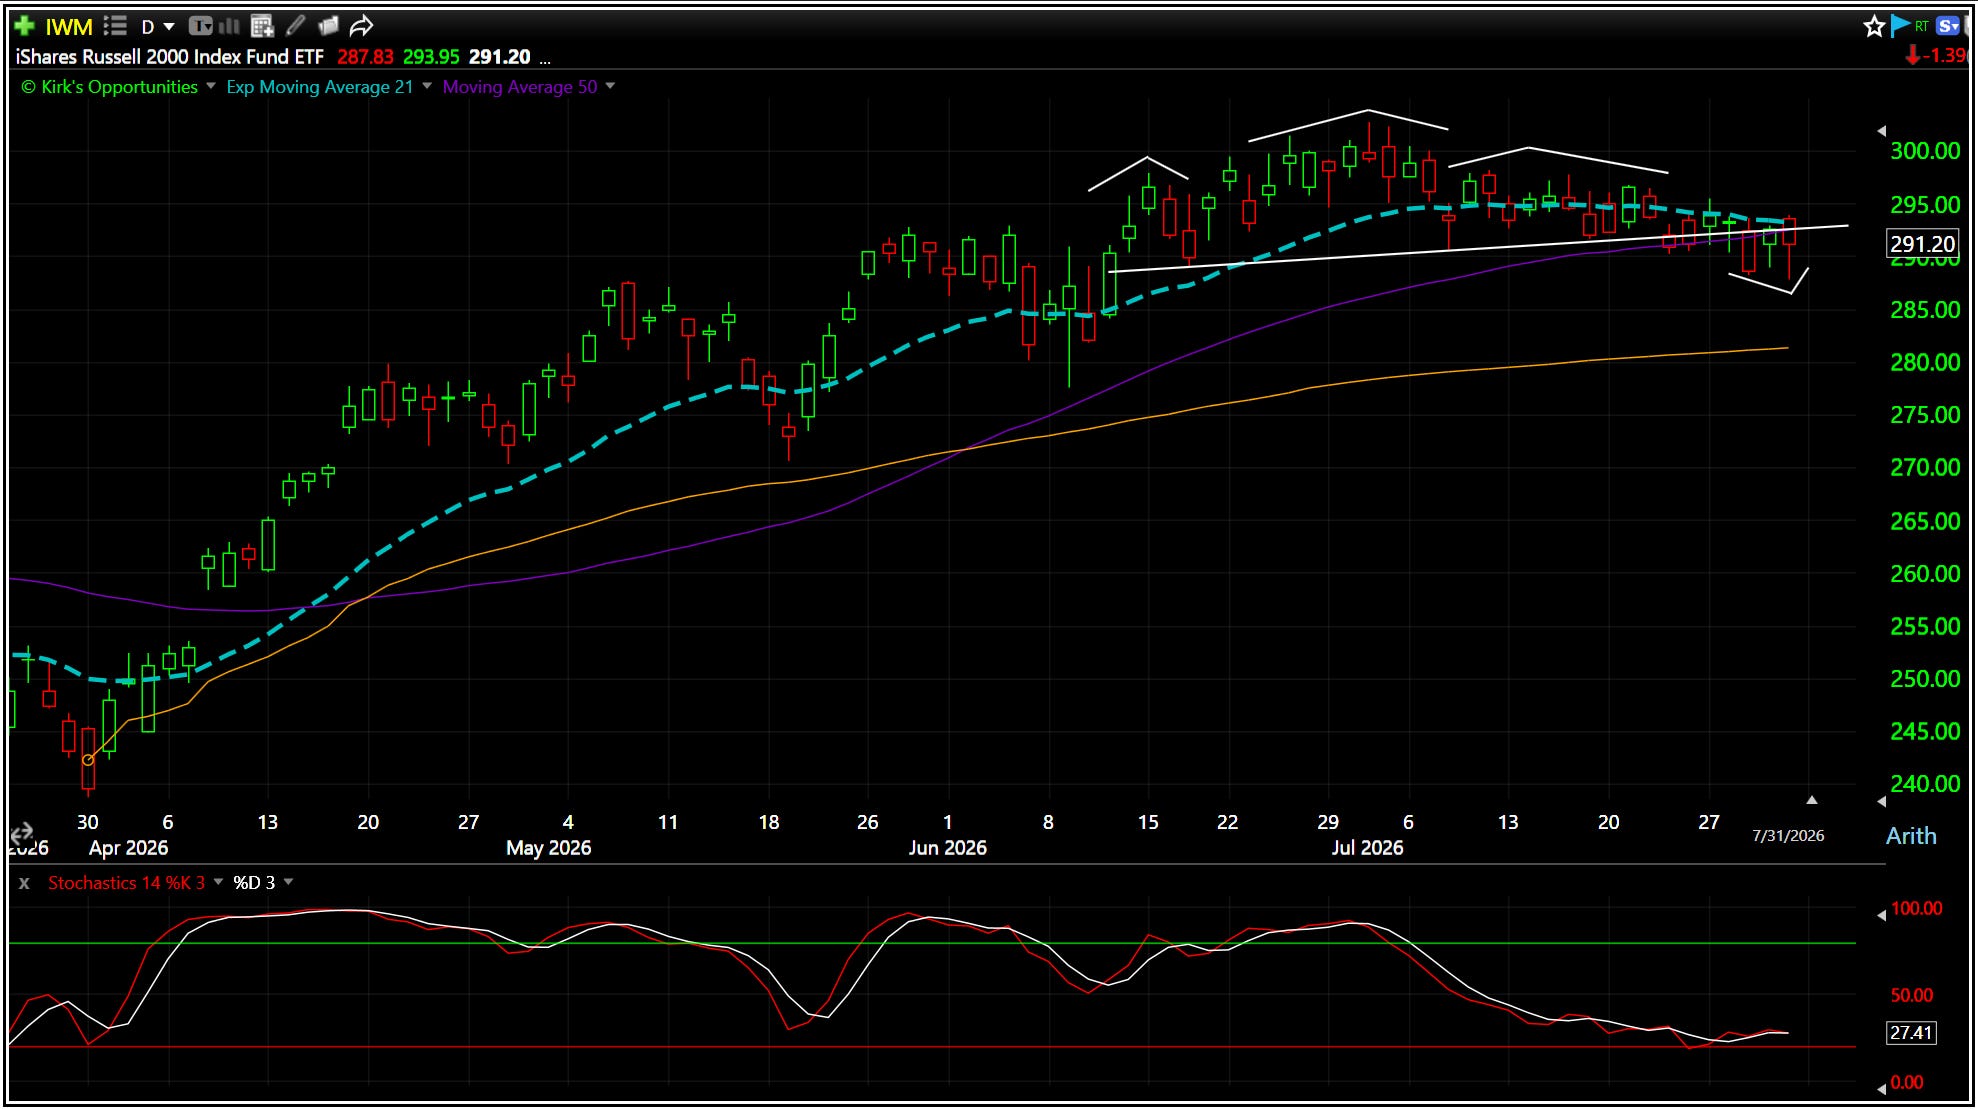
The S&P Mid Cap 400 and Russell 2000 also showed potential failed breakdowns inside their trading ranges.
Their bearish reversal patterns have not been completely invalidated. Continued movement above their right shoulders and July highs would effectively stop those setups and improve the broader-market picture.
For now, they remain potential bear traps rather than confirmed upside breakouts.
The major indexes remain inside their ranges, but the short-term evidence became more constructive last week.
The indexes also continue to hide the rolling corrections occurring beneath them. That has allowed the longer-term index trends to remain more positive than many individual portfolios may feel.
The Best Dip Is The One That Fails
As I shared in my notes last Wednesday, I outlined what we needed to watch for.
The best dip is the one that fails
A sharp break below support can look convincing in real time. Price drops fast, stops are triggered, people exit and suddenly everyone is preparing for the next leg down.
Sometimes that is exactly when the setup starts to improve.
The important part is not the break itself. It is what happens next.
When price slips below a prior low, fails to stay there, and then recovers the level, the breakdown has failed. Shorts who shorted the weakness are now trapped, while larger buyers may be using the flush to build positions.
That can create a powerful reversal.
This is why buying the first drop is usually not necessary. Let the market show its hand. A quick recovery of the lost level often tells you far more than the initial decline.
The setup is not complicated:
Support breaks.
Price refuses to continue lower.
The level is recovered.
Buyers take control again.
The market often creates the best opportunity only after making the bearish case look obvious.
That is the real value of a failed breakdown. It gives you confirmation without forcing you to guess where the bottom is.
Paid members can continue with the risk-management discussion, the complete July performance matrix, scenario probabilities, potential opportunities, and the portfolio plan for the week ahead.