

Stocks Bounce Back Through Big & Long Winning Streaks
Will This Volatility Be Followed By Even More Volatility Ahead?

The Bottom Line
Following a five-week losing streak, the market has now posted two positive weeks.
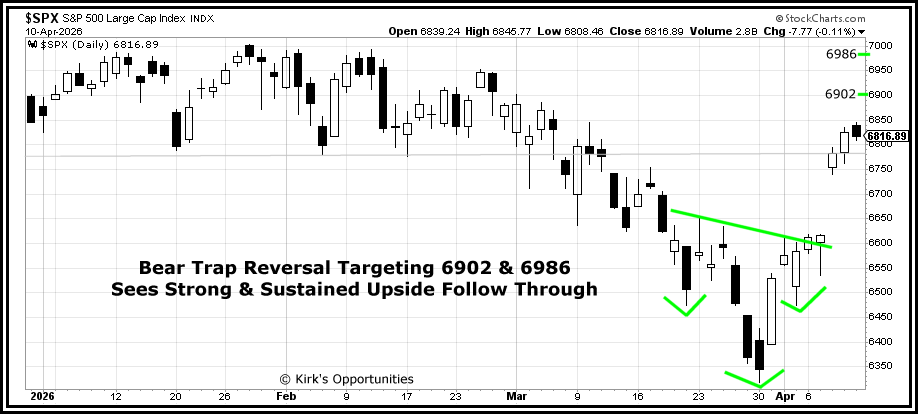
Bear trap reversals are in motion, laying the foundation for continued strength with numerous trailing support levels underneath in the multi-month trading range.
With buyers taking back control these past two weeks, much will depend in the short term on the reaction to earnings and any further fallout from the Iran war. It is quite possible this back-and-forth volatility will persist longer.
The Price Action
Ahead of Easter, the bear trap was set.
After Easter, the bulls took advantage of it.
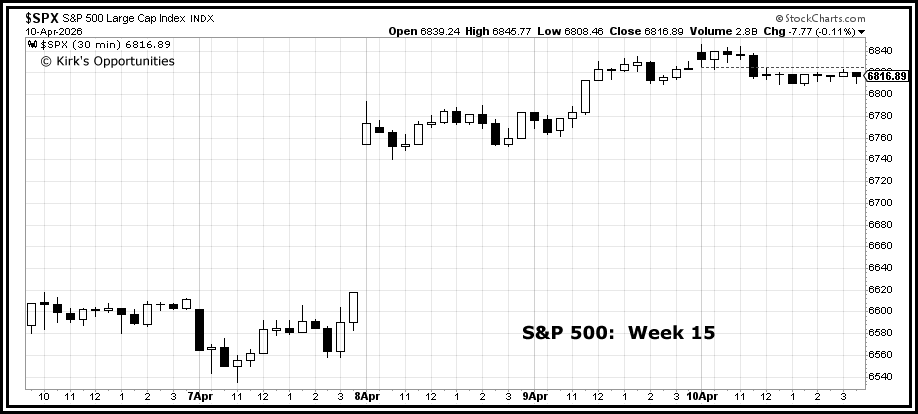
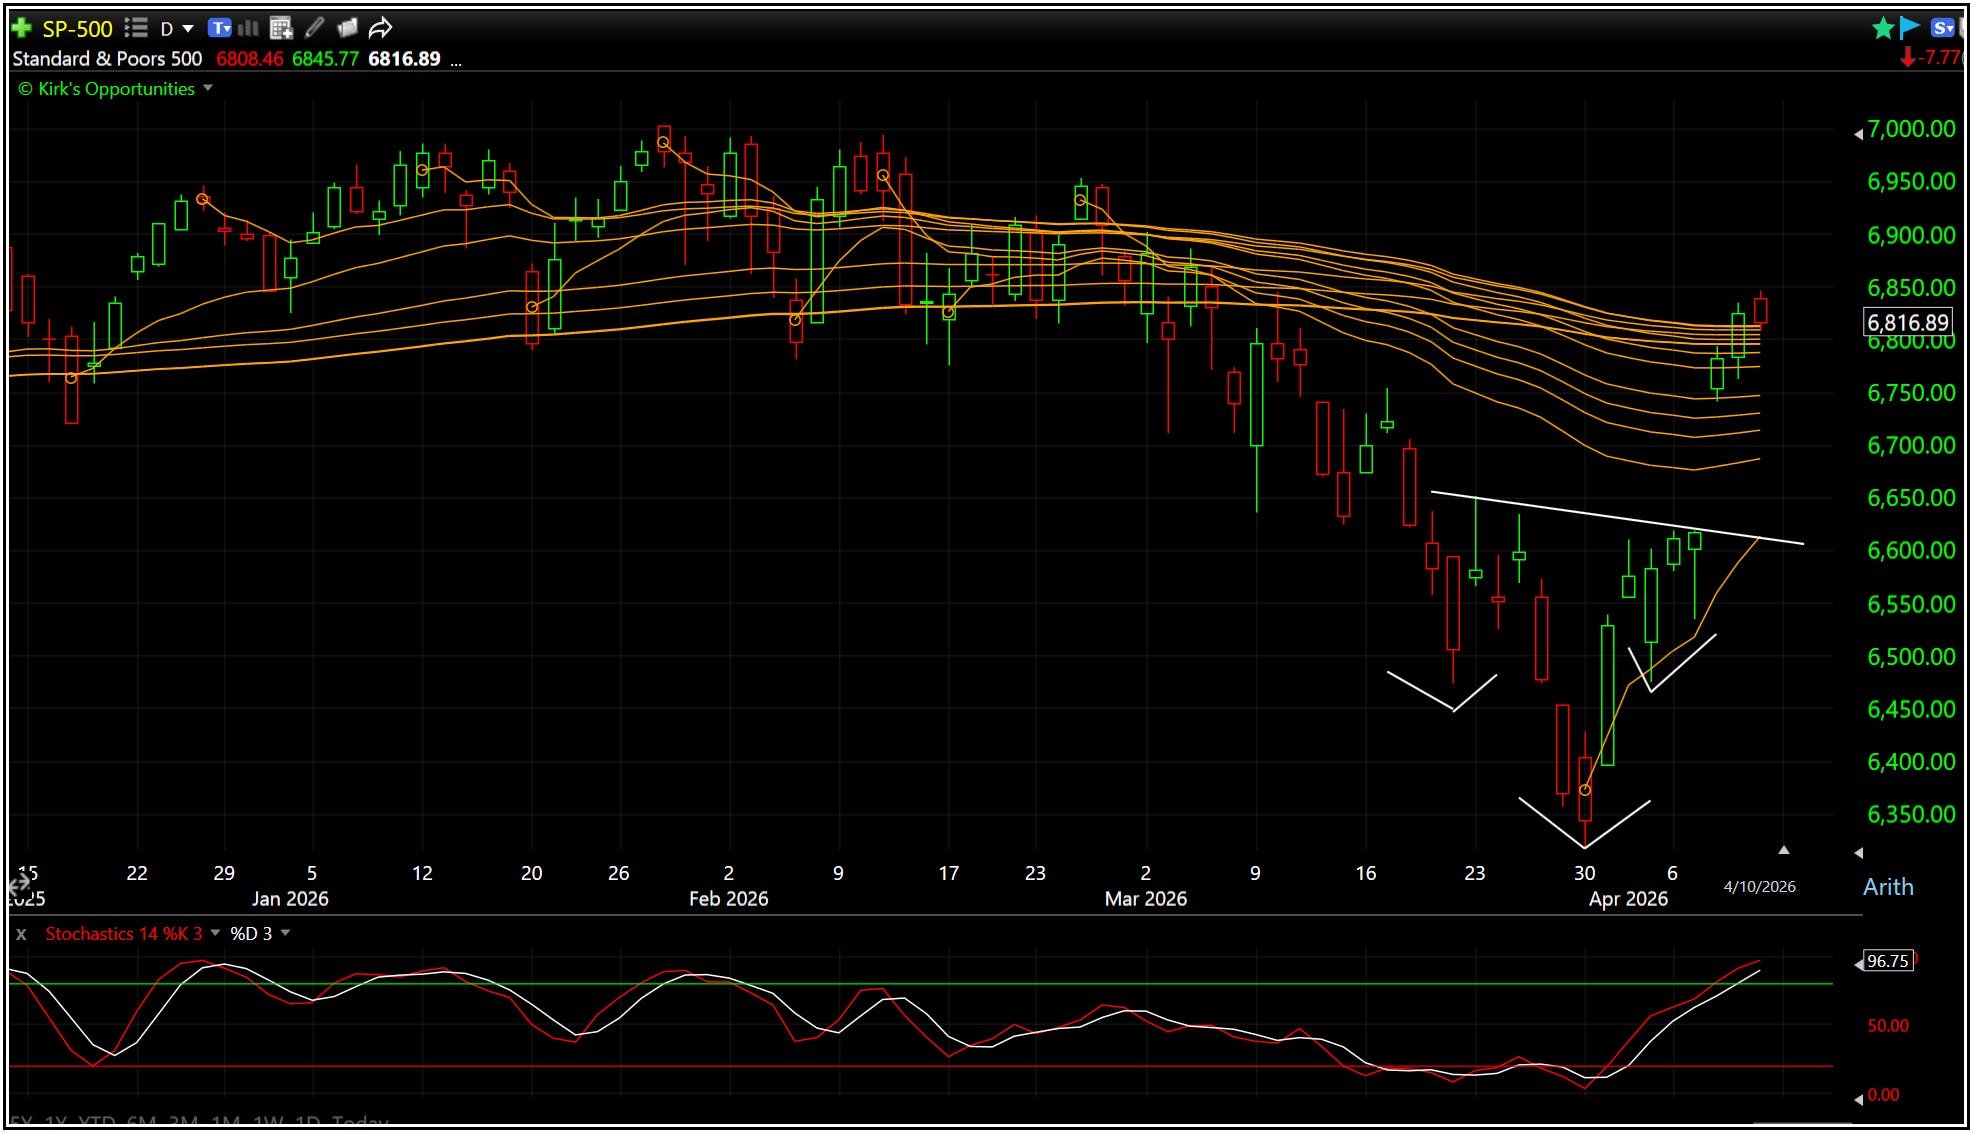
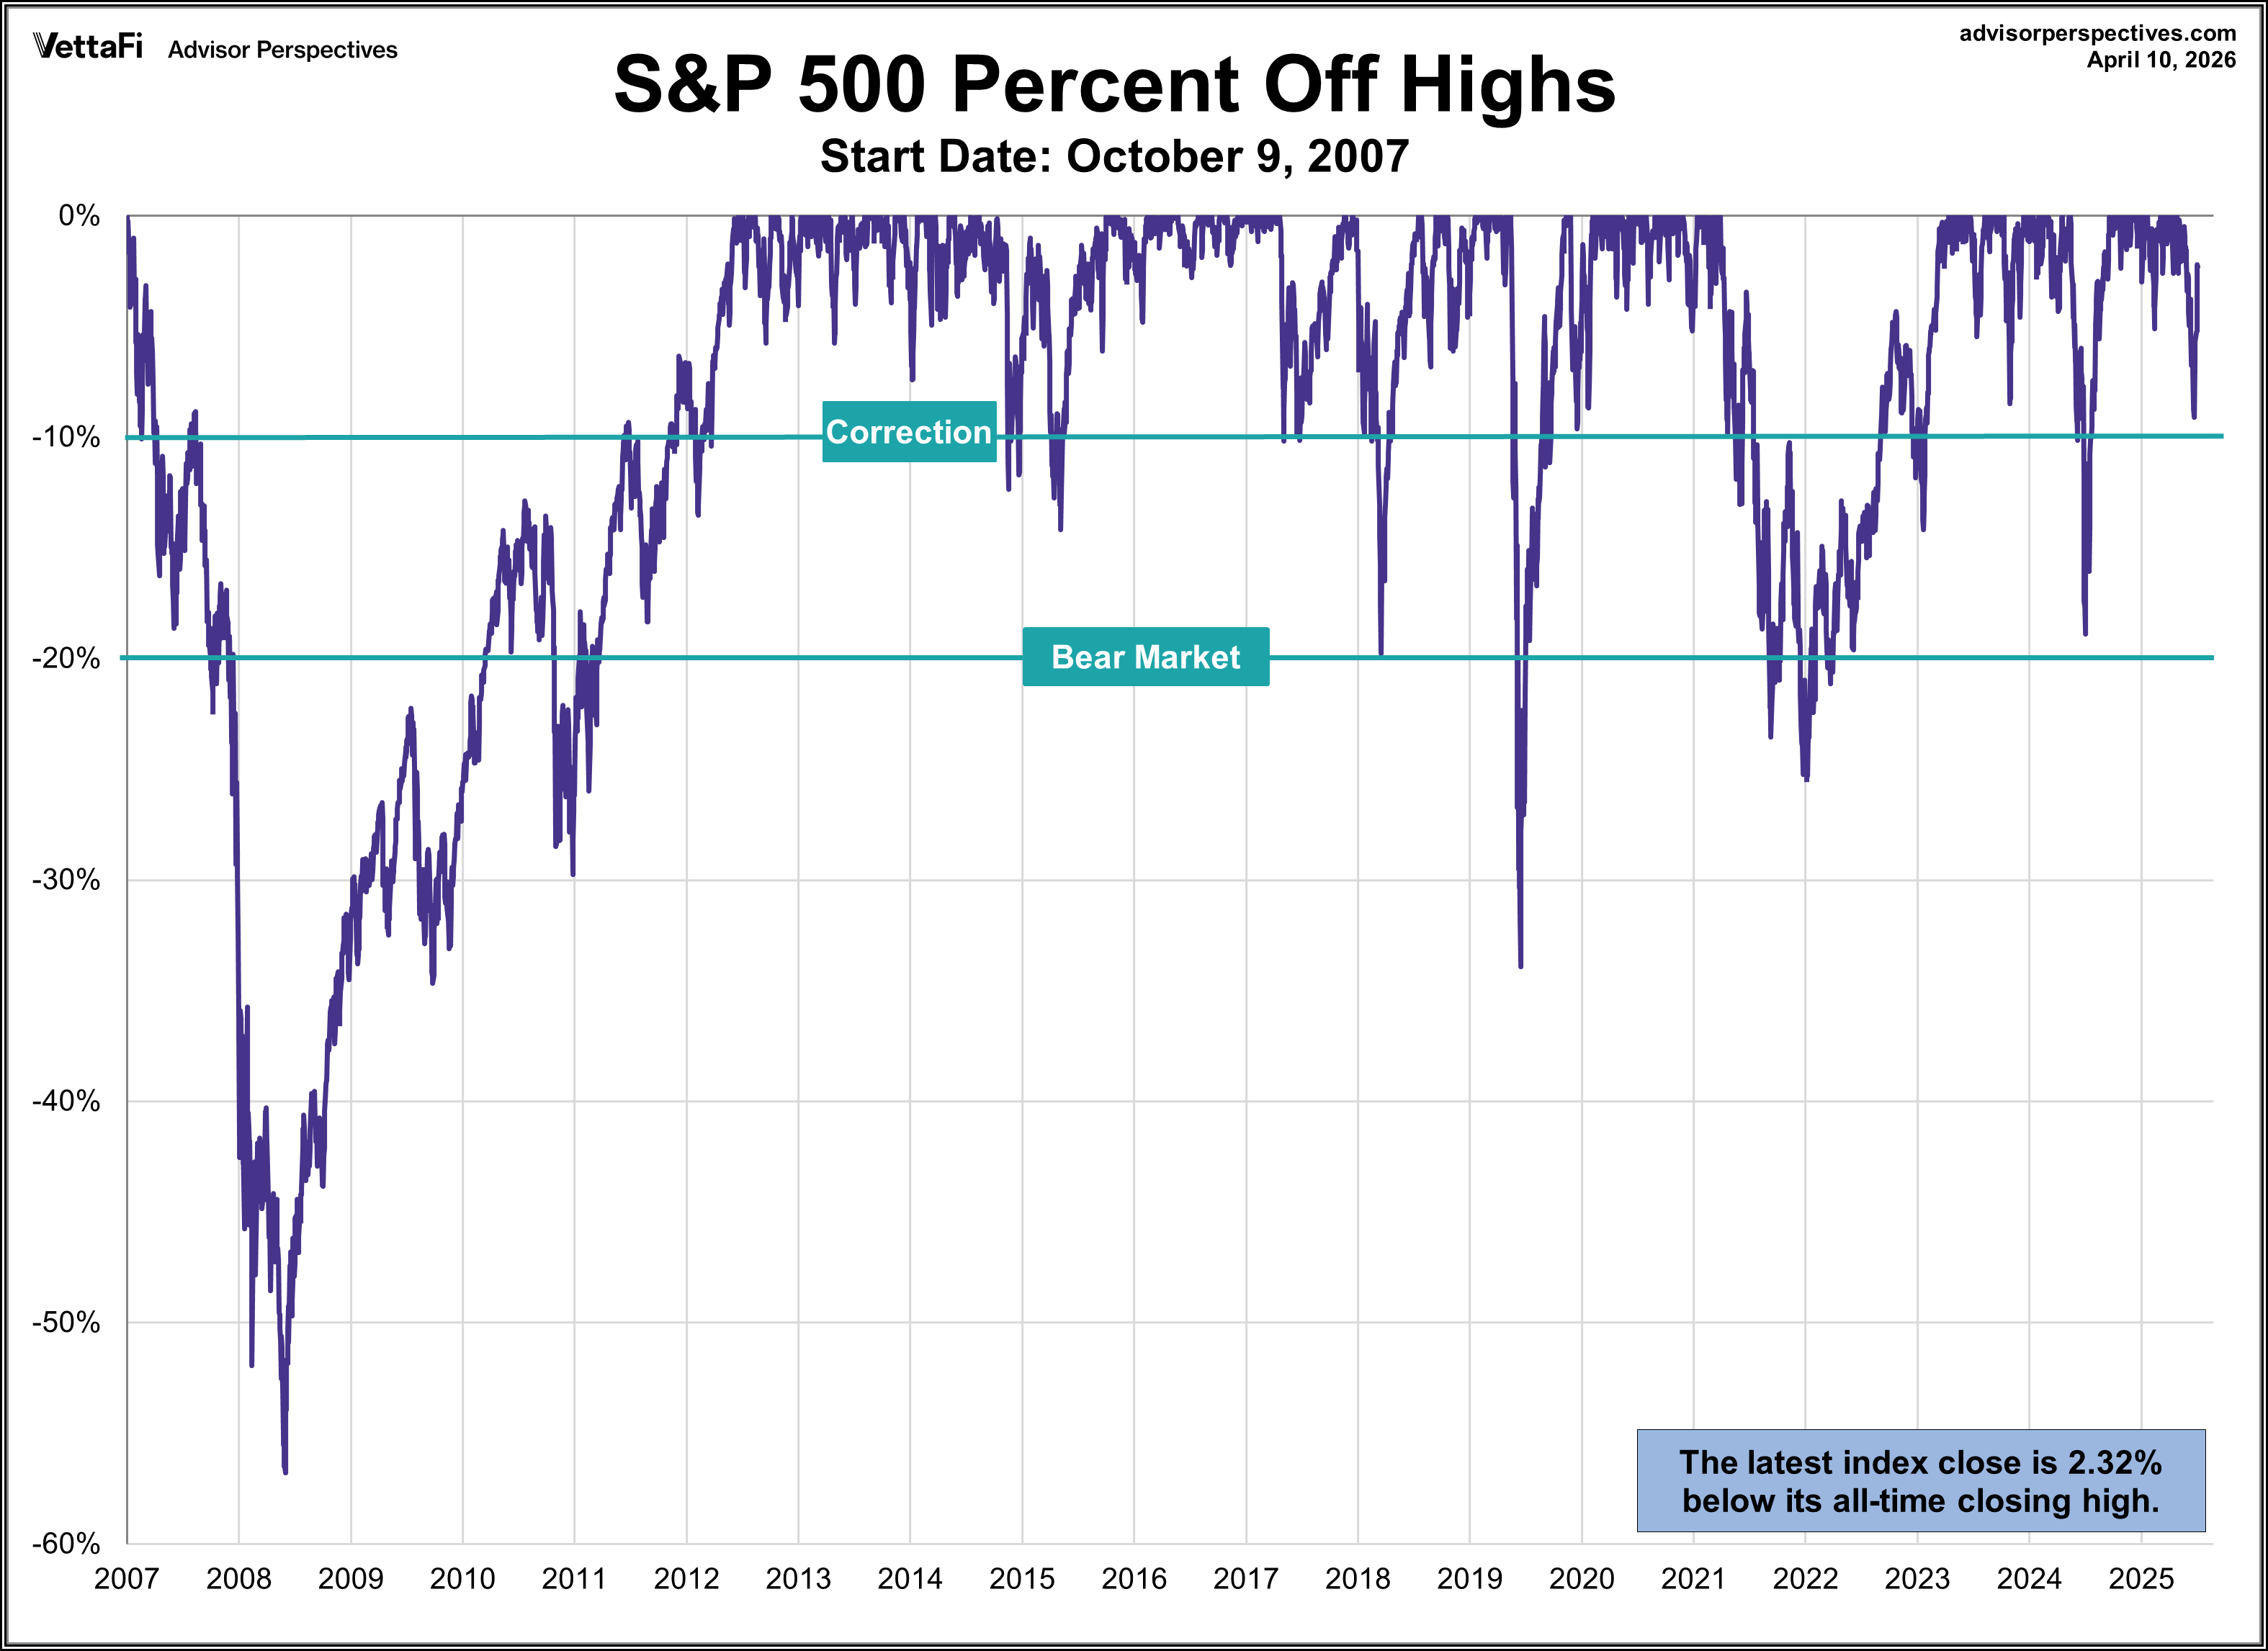
For seven straight positive days, including four last week, price climbed +8% from its March 31st intraday low. By last Friday’s close, the S&P 500 was only +2.7% below its prior January high.
An intraday turnaround last Tuesday followed by a large gap-higher open on Wednesday was the one-two punch markets needed for the bounce back to continue.
The bear trap reversal (inverse head and shoulders play) saw strong and sustained upside follow through. The longer price holds strong this week, the more likely it is that at least one, if not both, targets will be reached.
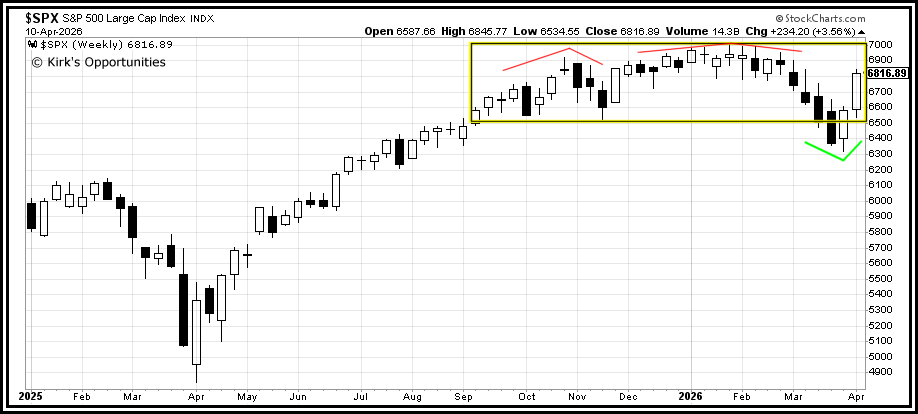
The weekly view below shows price has climbed well into its multi-month trading range, effectively trapping the double-top reversal within the range. Previously, the area between S&P 6800 and 7002 proved to be formidable overhead resistance:
It is quite possible that the volatility we’ve seen over the past two months, first down and then right back up, could beget even more volatility ahead.
While everyone seems to think/expect that we’ve seen another event like last year that the market will quickly put behind it and move on to new highs, this one may not play out the same way. There is a lot of recency bias type thinking out there, so we very much have to be prepared for anything and make minor adjustments along the way instead of taking on aggressive, one-directional positioning like before.
If there is an attempt to target and fill last week’s big unfilled gap (which seems at least possible), I will be watching to see if price finds trailing support at the major moving averages (especially the 200 day). It is quite an achievement to see price rally above all of these levels last week. It would be an even greater achievement to hold above them on any throwback retests.
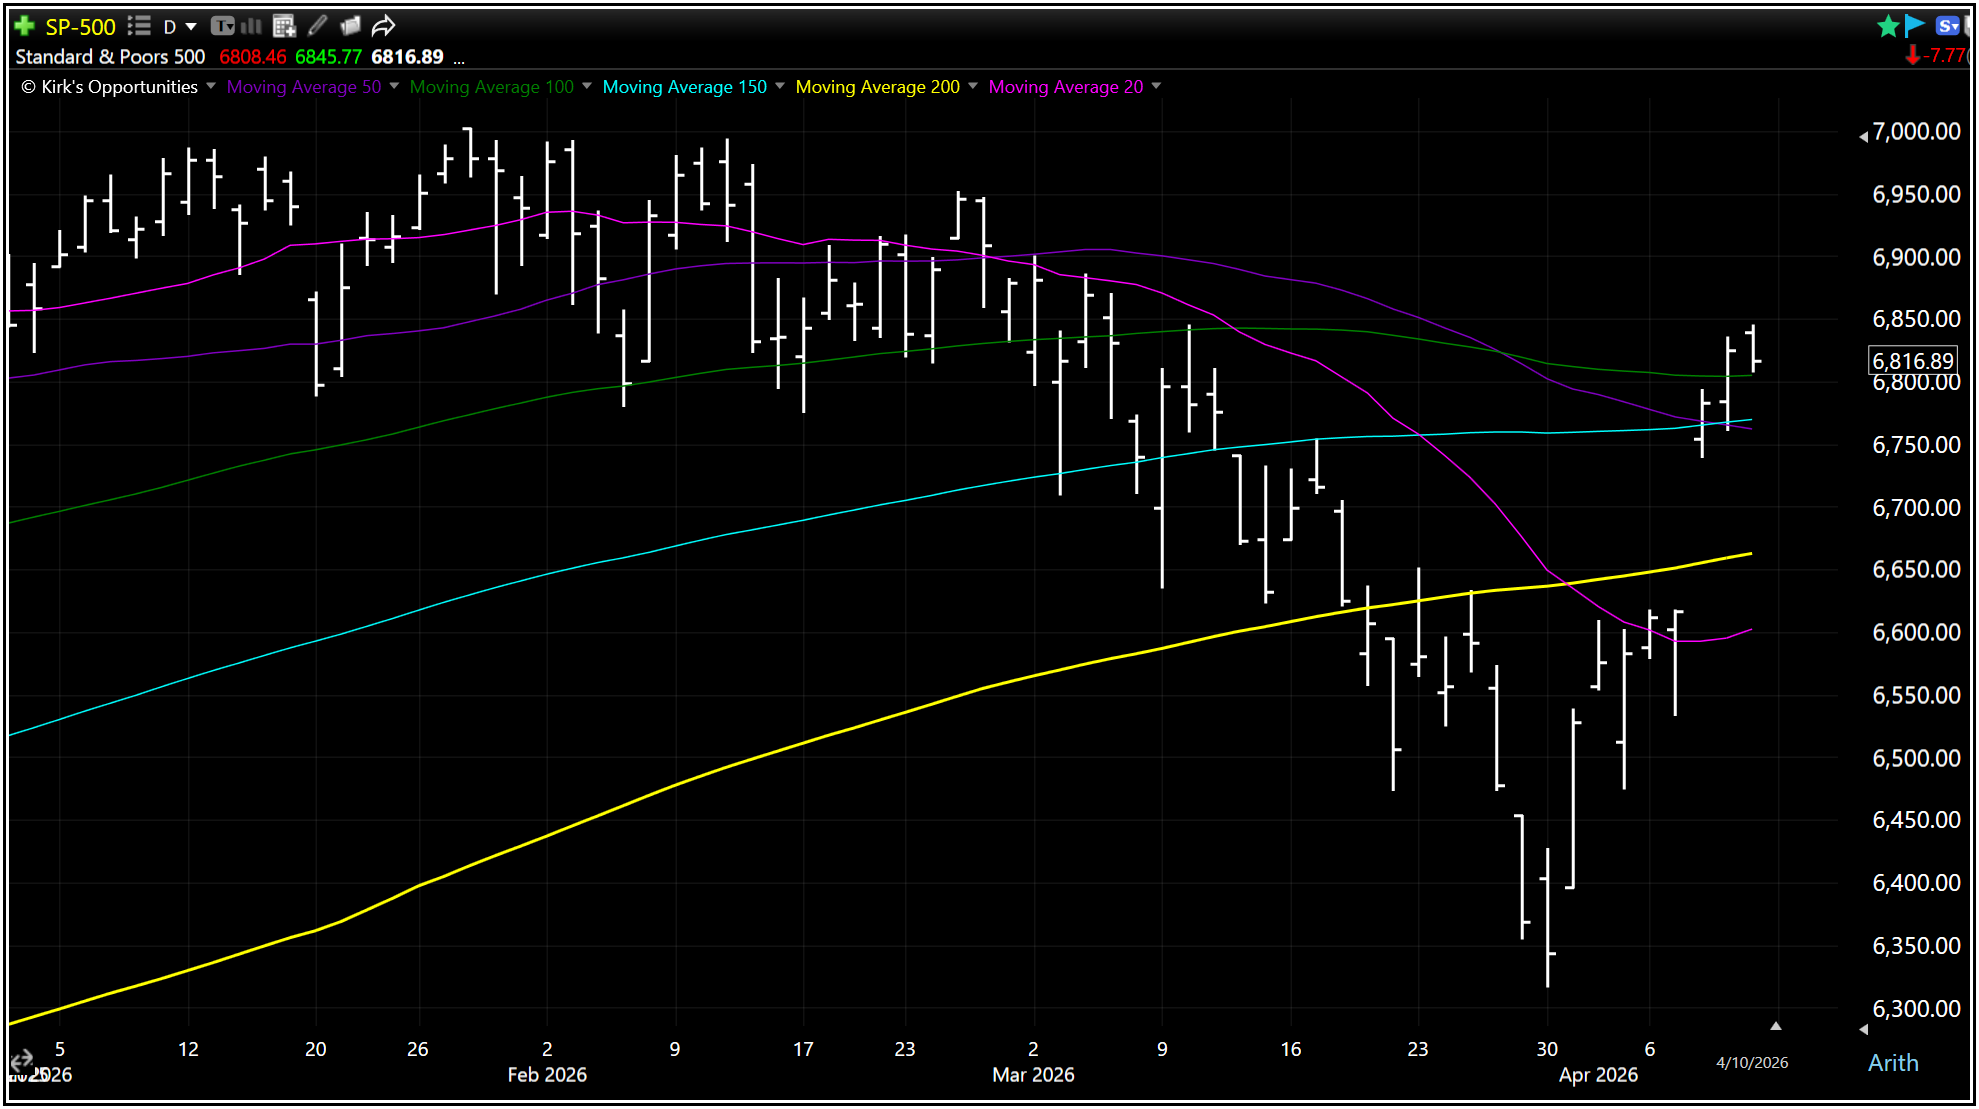
I will also be keeping an eye on the AVWAPs for potential trailing support levels. With overbought conditions back in effect, we want to see prices continue to remain overbought for even longer as a sign that price action is improving, not just a severe oversold bounce and nothing more.
After this lengthy period of consolidation combined with the five-week nearly -10% drawdown from the fury, markets will be hoping that was enough to stage another “shake out, then breakout” move we’ve seen so often before.
That seems overly optimistic all things considered, but we are keeping an open mind.
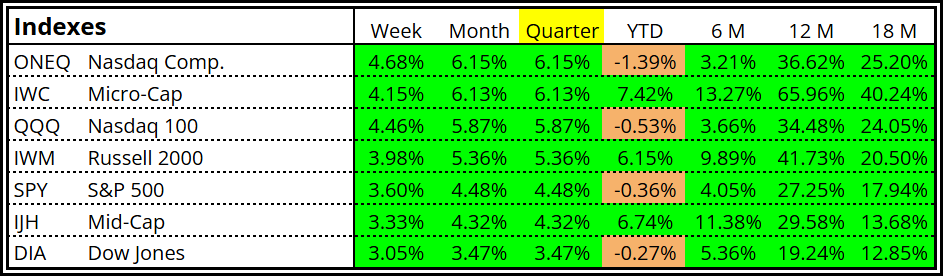
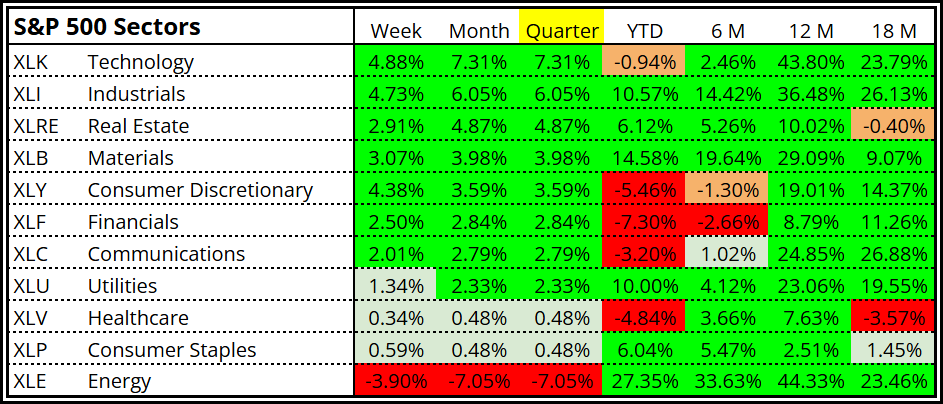
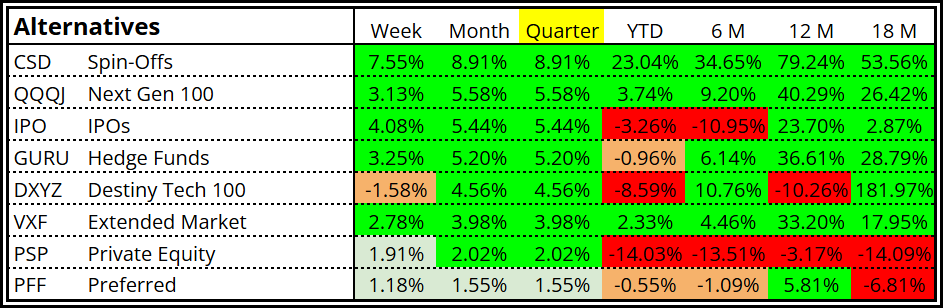
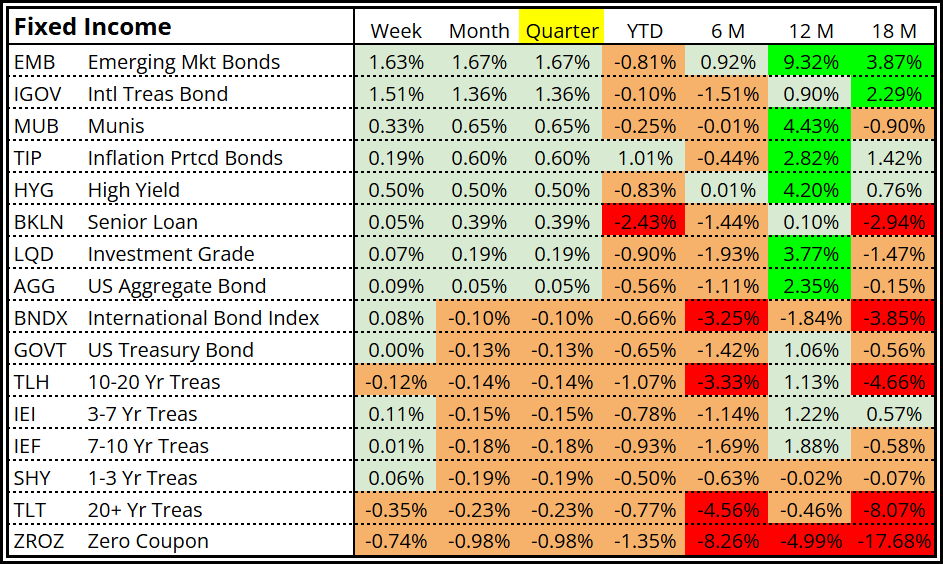
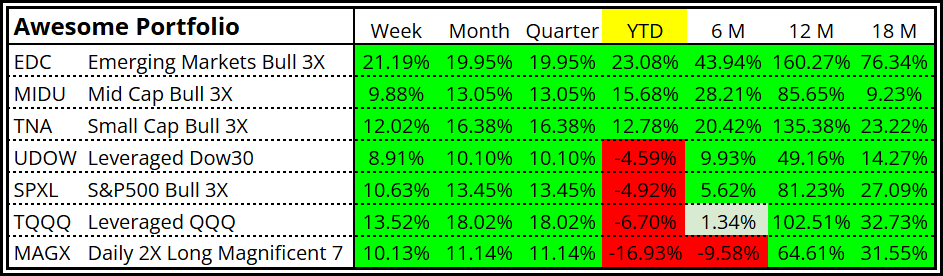
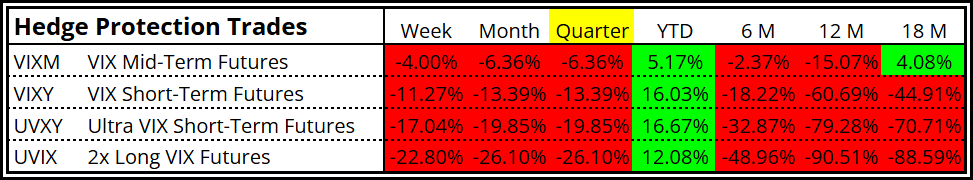
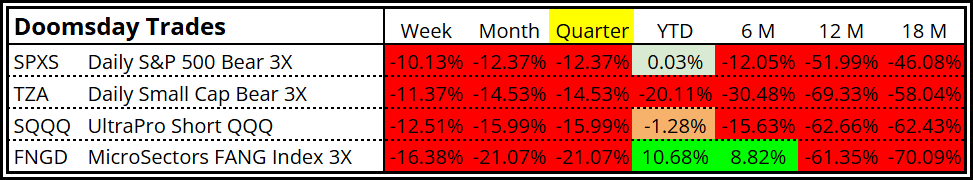
Performance Matrix
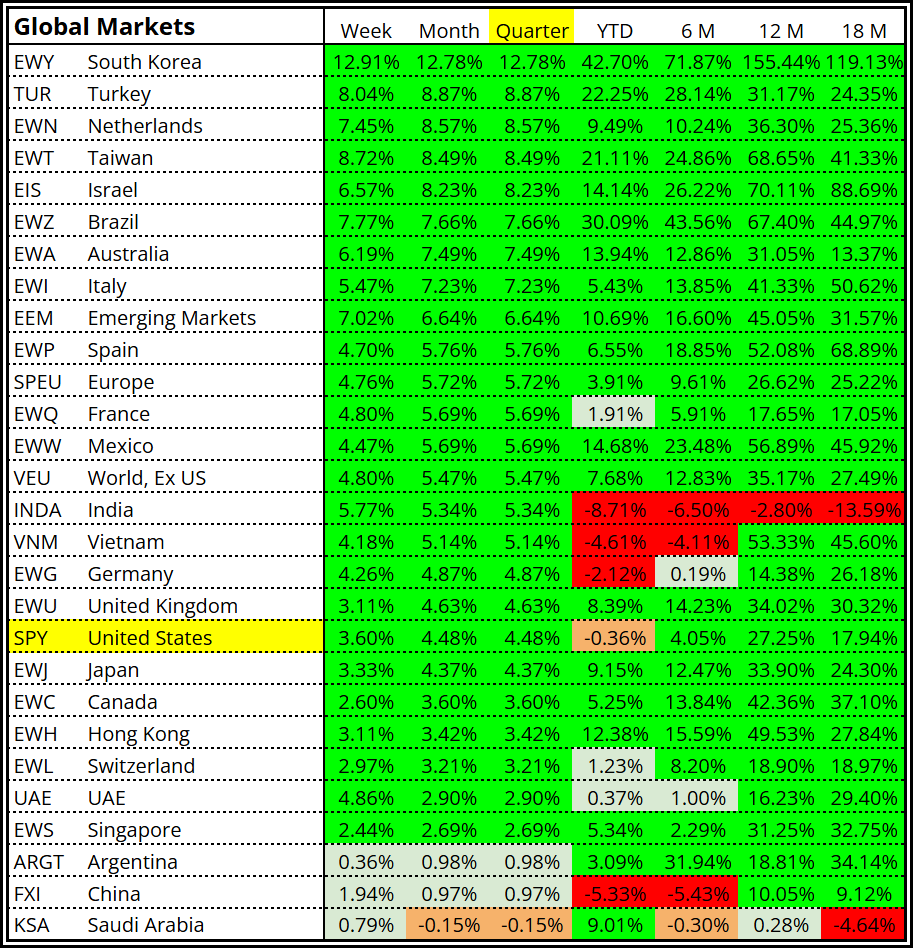
Given the significant strength seen since the last day of the first quarter, we should take note of the early improvement trends so far in April and the second quarter.
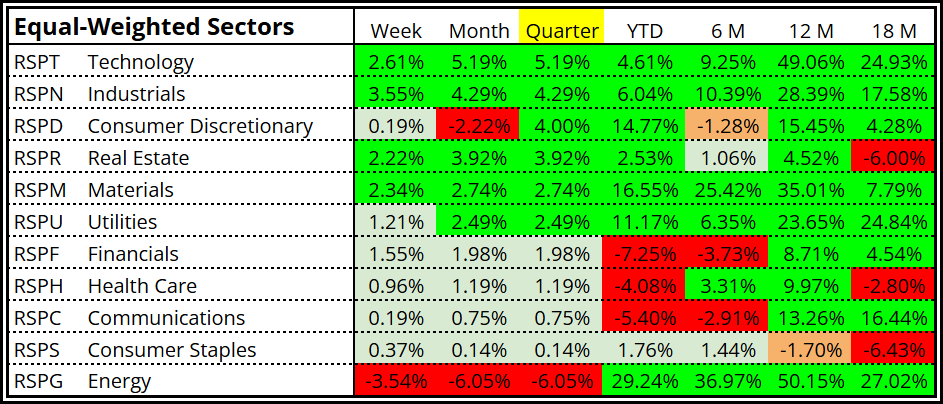
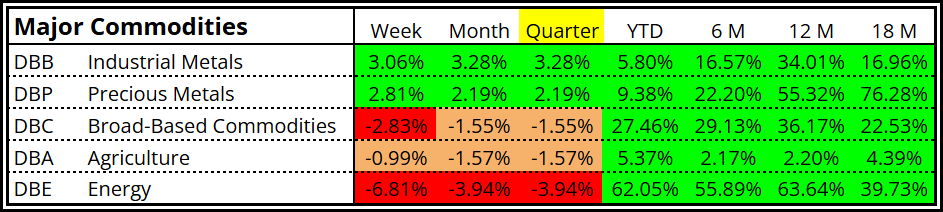
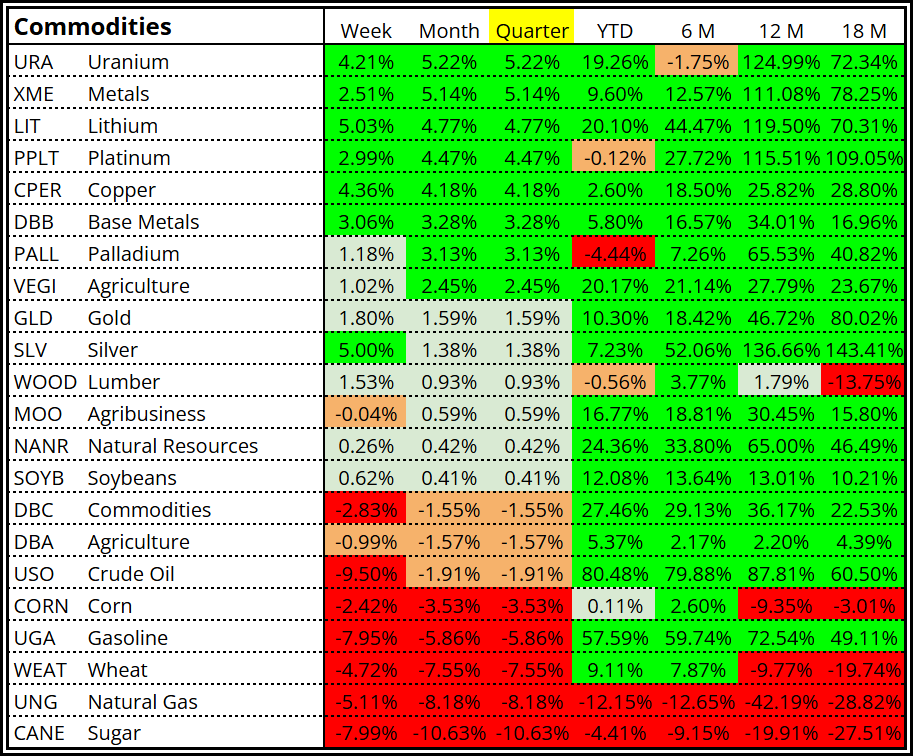
While weakness in energy-related stocks and commodities will come as no surprise due to the reduced war-premium, a few additional themes include:
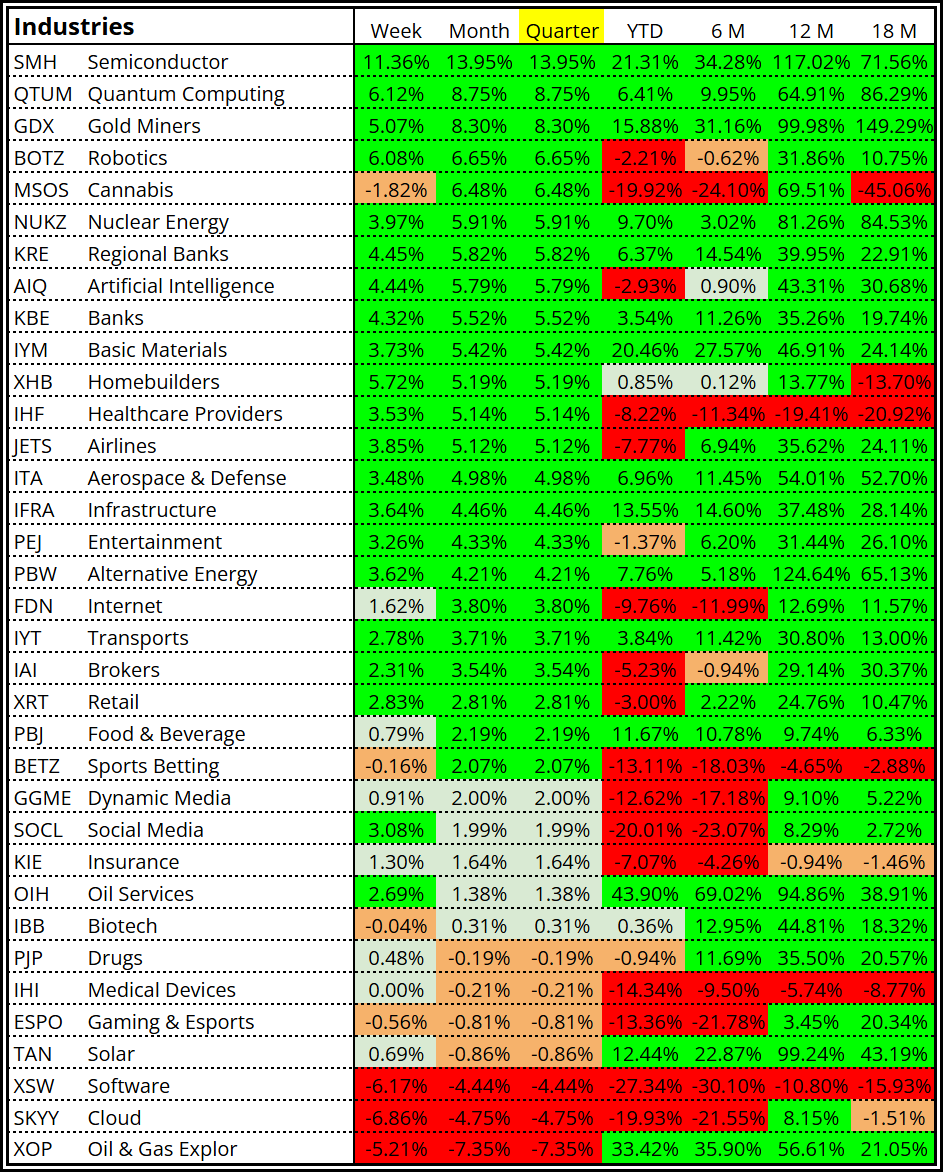
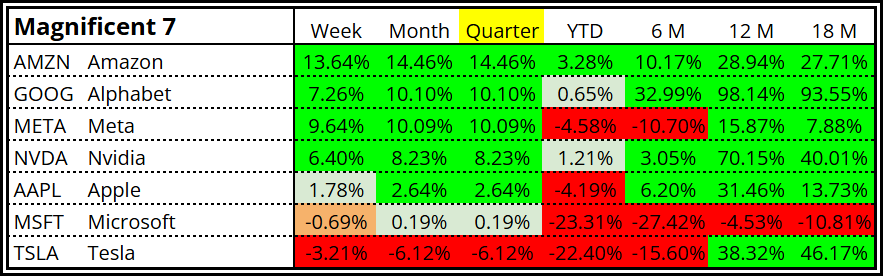
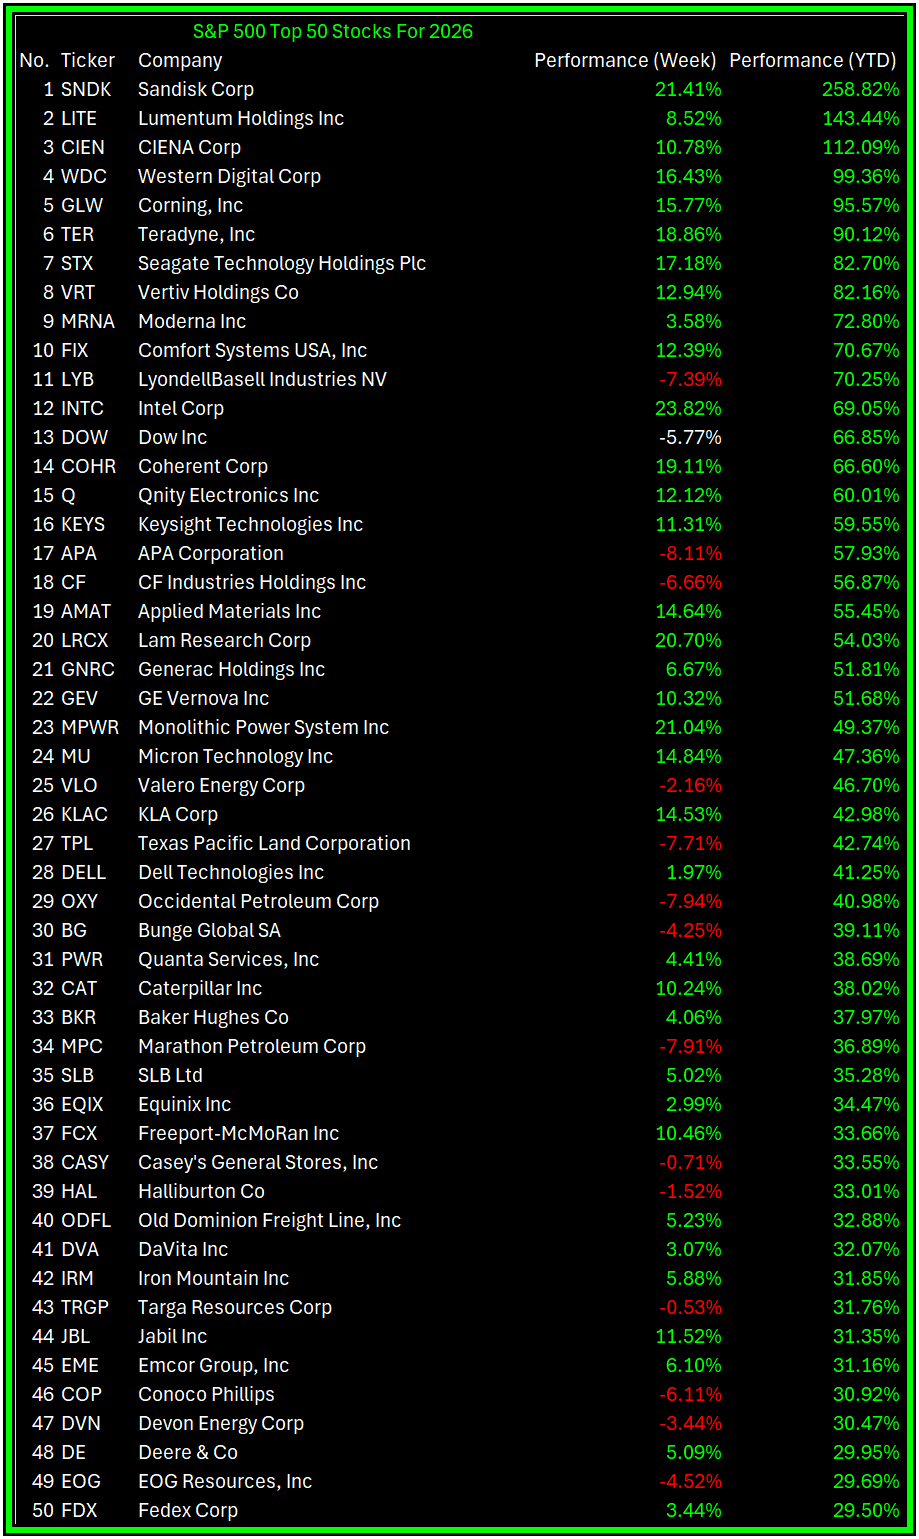
Stocks viewed as benefiting from the AI revolution significantly outperformed (chips, memory, computing, hardware, telecom, robotics, industrial automation, nanotechnology, rare earths)
Stocks viewed as losers from the AI revolution were significantly weaker (software and cybersecurity)
Stocks related to the space industry outperformed (satellites, infrastructure, data analytics, logistics and launch services, etc.)
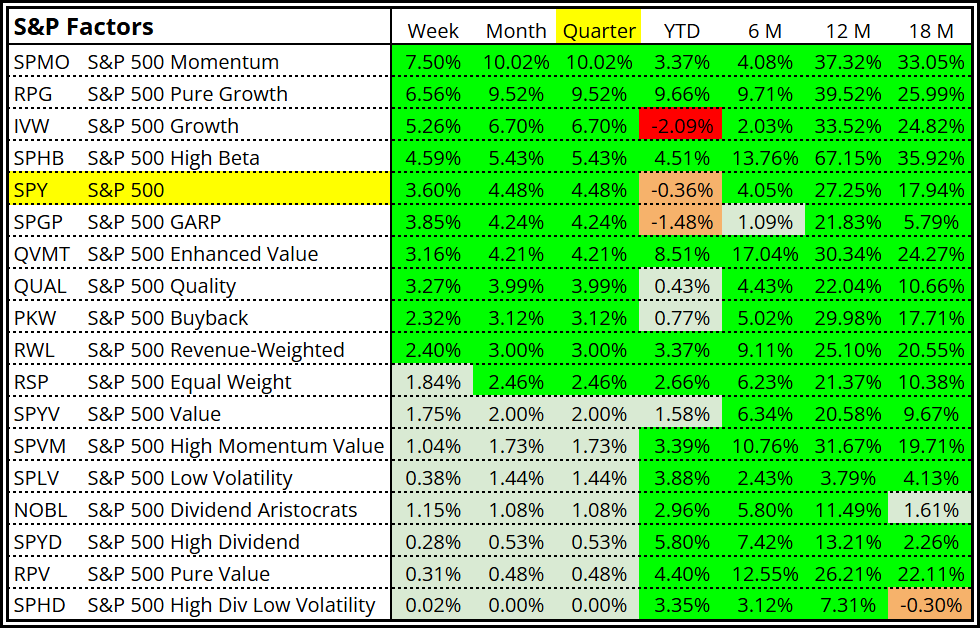
Best Performers: Semiconductors (SMH), South Korea (EWH), S&P 500 Momentum (SPMO), S&P 500 Pure Growth (RPG), Spin-Offs (CSD), Turkey (TUR), Quantum Computing (QTM), Netherlands (EWN), Taiwan (EWT), and Gold Miners (GDX)
Worst Performers: Sugar (CANE), Natural Gas (UNG), Wheat (WEAT), Oil & Gas Exploration (XOP), Energy (XLE), Energy Equal Weight (RSPG), Gasoline (UGA), Cloud Computing (SKYY), Software (XSW), and Energy Commodities (DBE).
A few reminders:
• Watch breadth, not just index levels
• Monitor leadership consistency, not one-day moves
• Track reaction to news rather than news itself
• Pay attention to how dips are bought or sold
My Take
After threatening to blast Iran back to the stone age during Easter weekend, it was quite a turn of events over just a few days, even for Trump
With the Iran war “already won” and any and all potential negative impacts “only transitory,” the hope on the Street is that the correction has finished and the market has “reset itself” for much better days ahead.
Trump said as much last Thursday morning:
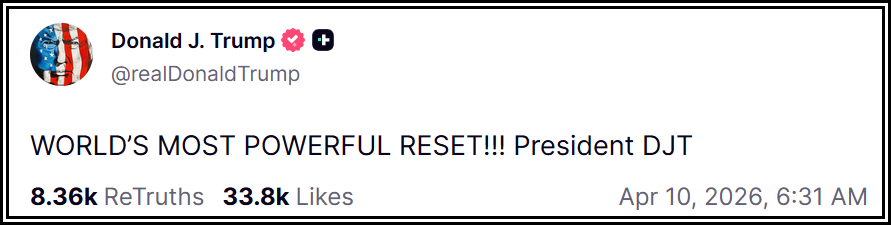
In other words, the old “let’s knock them down, so we can ride them back up” game. After all, those mid-term poll numbers aren’t going to improve all by themselves!
While it wasn’t the “It is a great time to buy!” tweet, perhaps this was enough now that the U.S. Navy is effectively in charge of the Strait of Hormuz toll booth?
My perspective is that as much as we want to believe the Iran war risk has been removed for good, it is still possible it may not play out that way.
