

Thursday, September 17, 2026
Yesterday, I asked what might happen when something finally started going right.
Today gave us an answer: oil eased, Treasury yields retreated, and buyers returned.
The combination I want to see from here is straightforward: oil stabilizes or continues lower, yields stop climbing, breadth keeps improving, and leadership expands beyond a handful of AI winners. Together, those developments would strengthen the case that Wednesday’s Fed selloff was a buyable, bear trap dip within the ongoing uptrend under seasonal consolidation.
However, if the bounce quick fades while oil and yields turn higher again and more stocks lose their 200-day trends at week’s end, today will be nothing but an oversold bounce. An oversold bounce to sell into rather than buy.
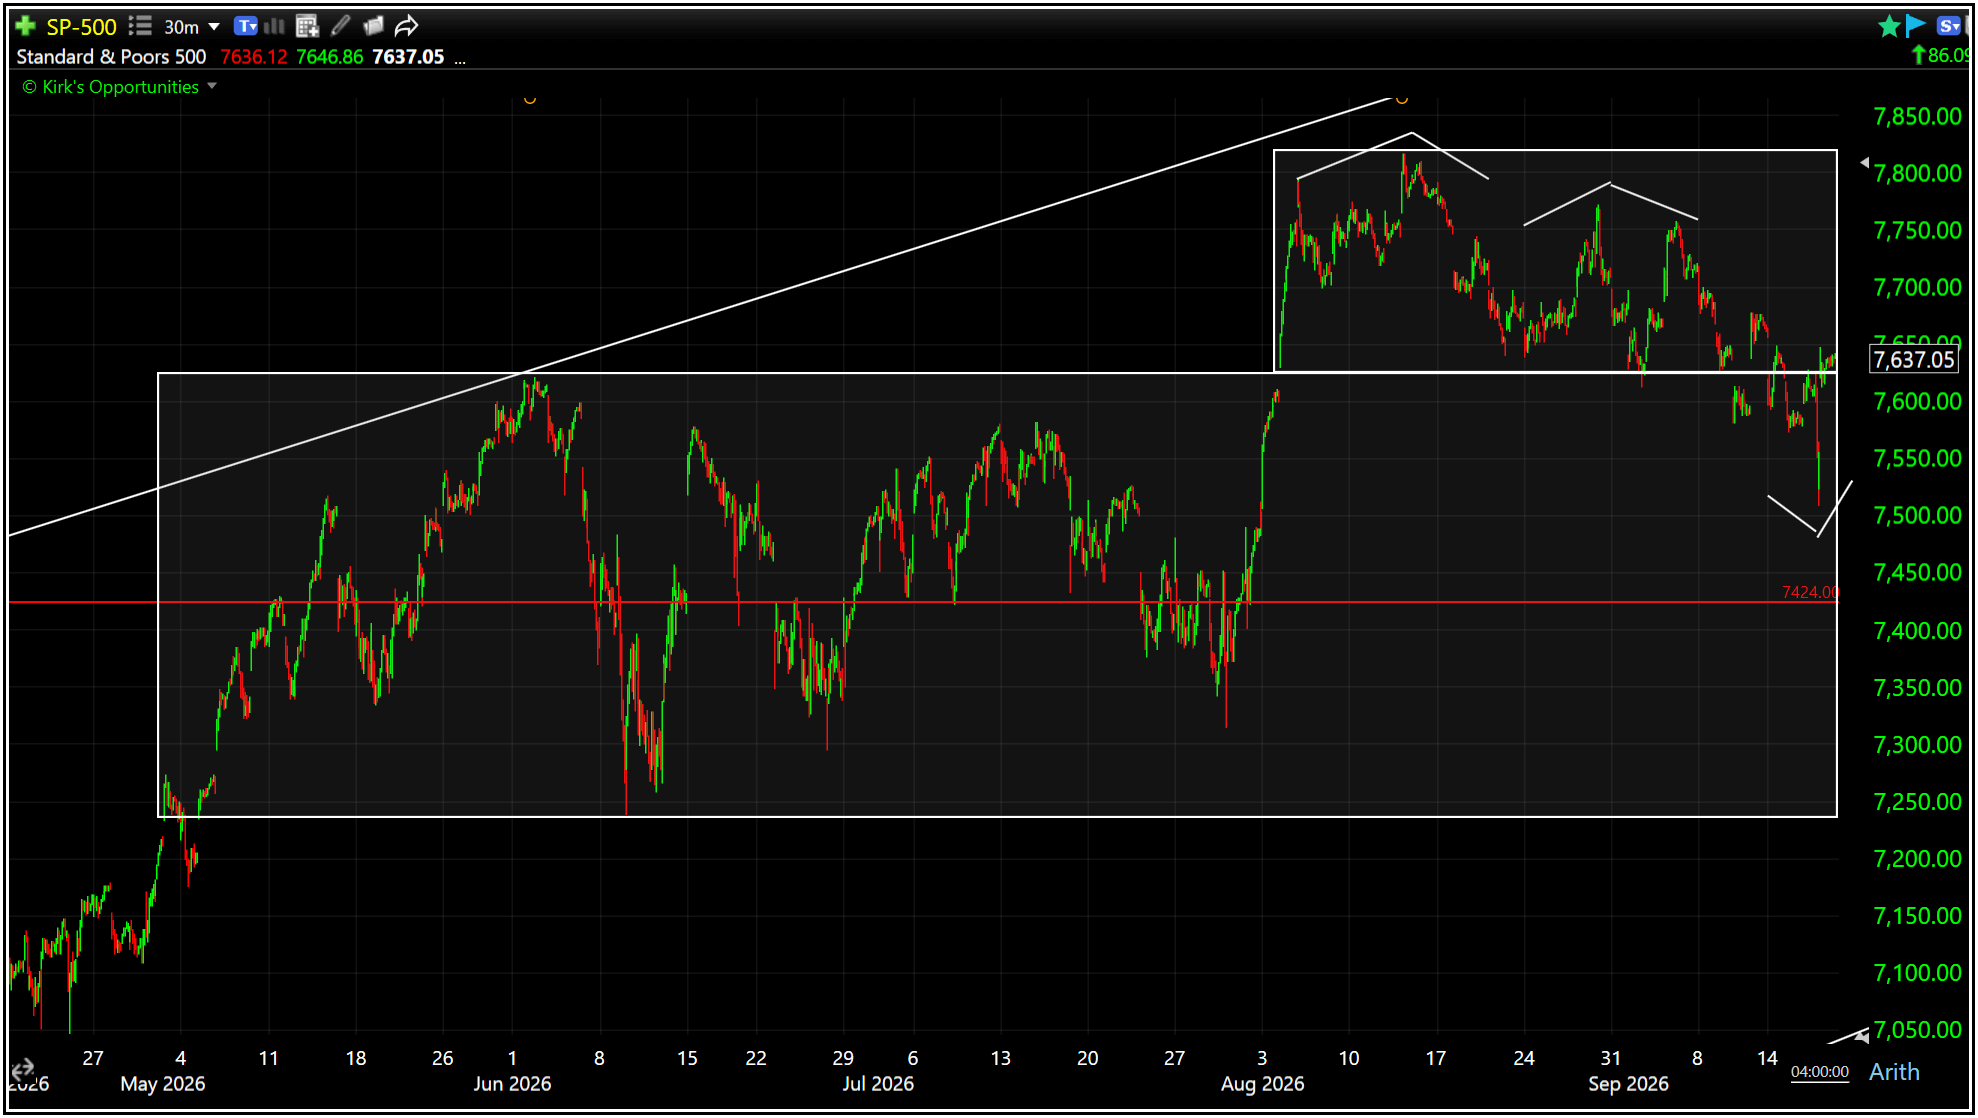
While the price action clearly improved in today’s strength, the next test is whether buyers can hold their ground and break the series of short-term lower highs, lower lows from the August high.
Short of that, a defensive posture remains justified.
THE OPPORTUNITY
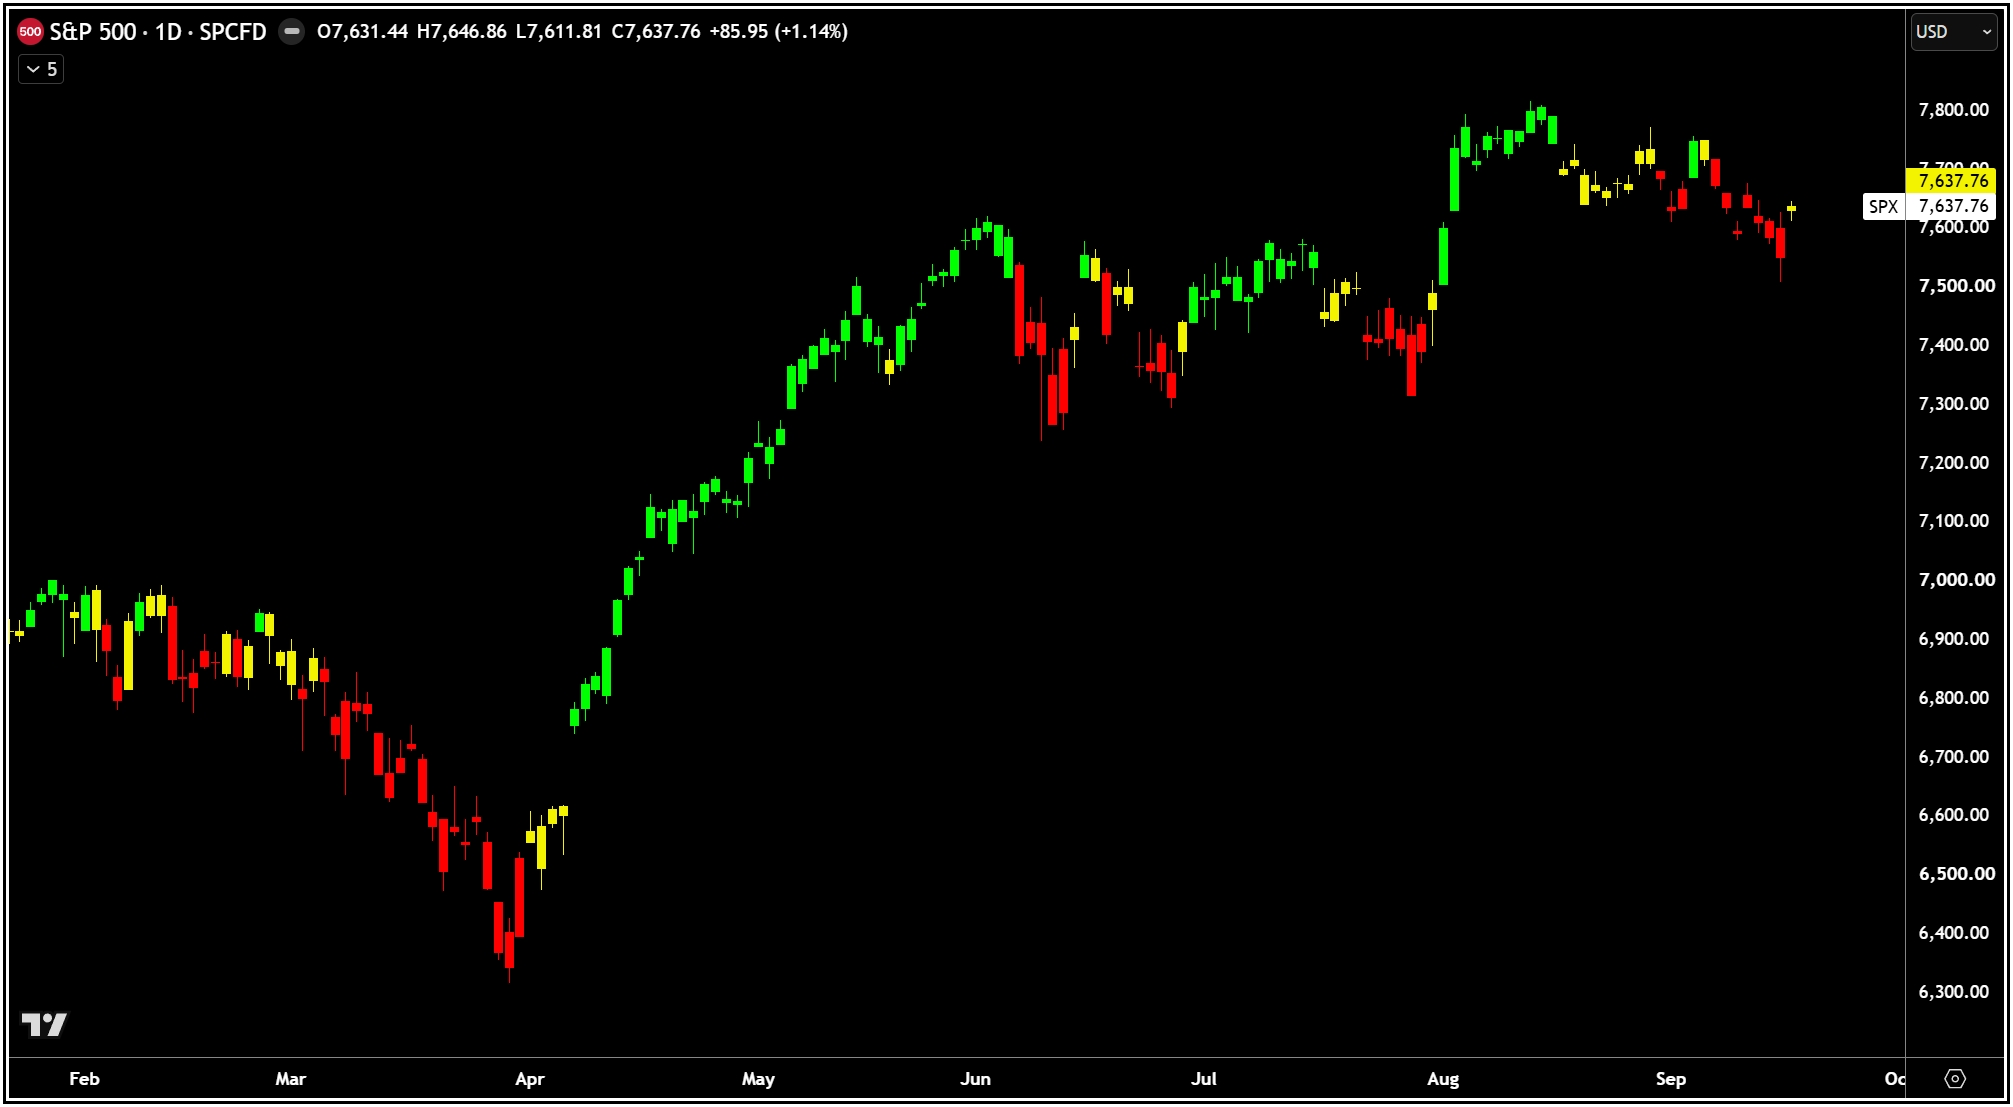
The S&P 500 gained 1.14% to 7637.76, pushing back above the June high at 7620 and its 50-day moving average at 7615 after three consecutive closes below that area.
A clear pivot area in which price is being squeezed between its short-term trailing resistance at the 20/21EMAs and its longer-term trailing support at the 50 day, 100 day, and Ichimoku cloud below it.
To gain the upper hand again, buyers need to show they can take control at this pivot.
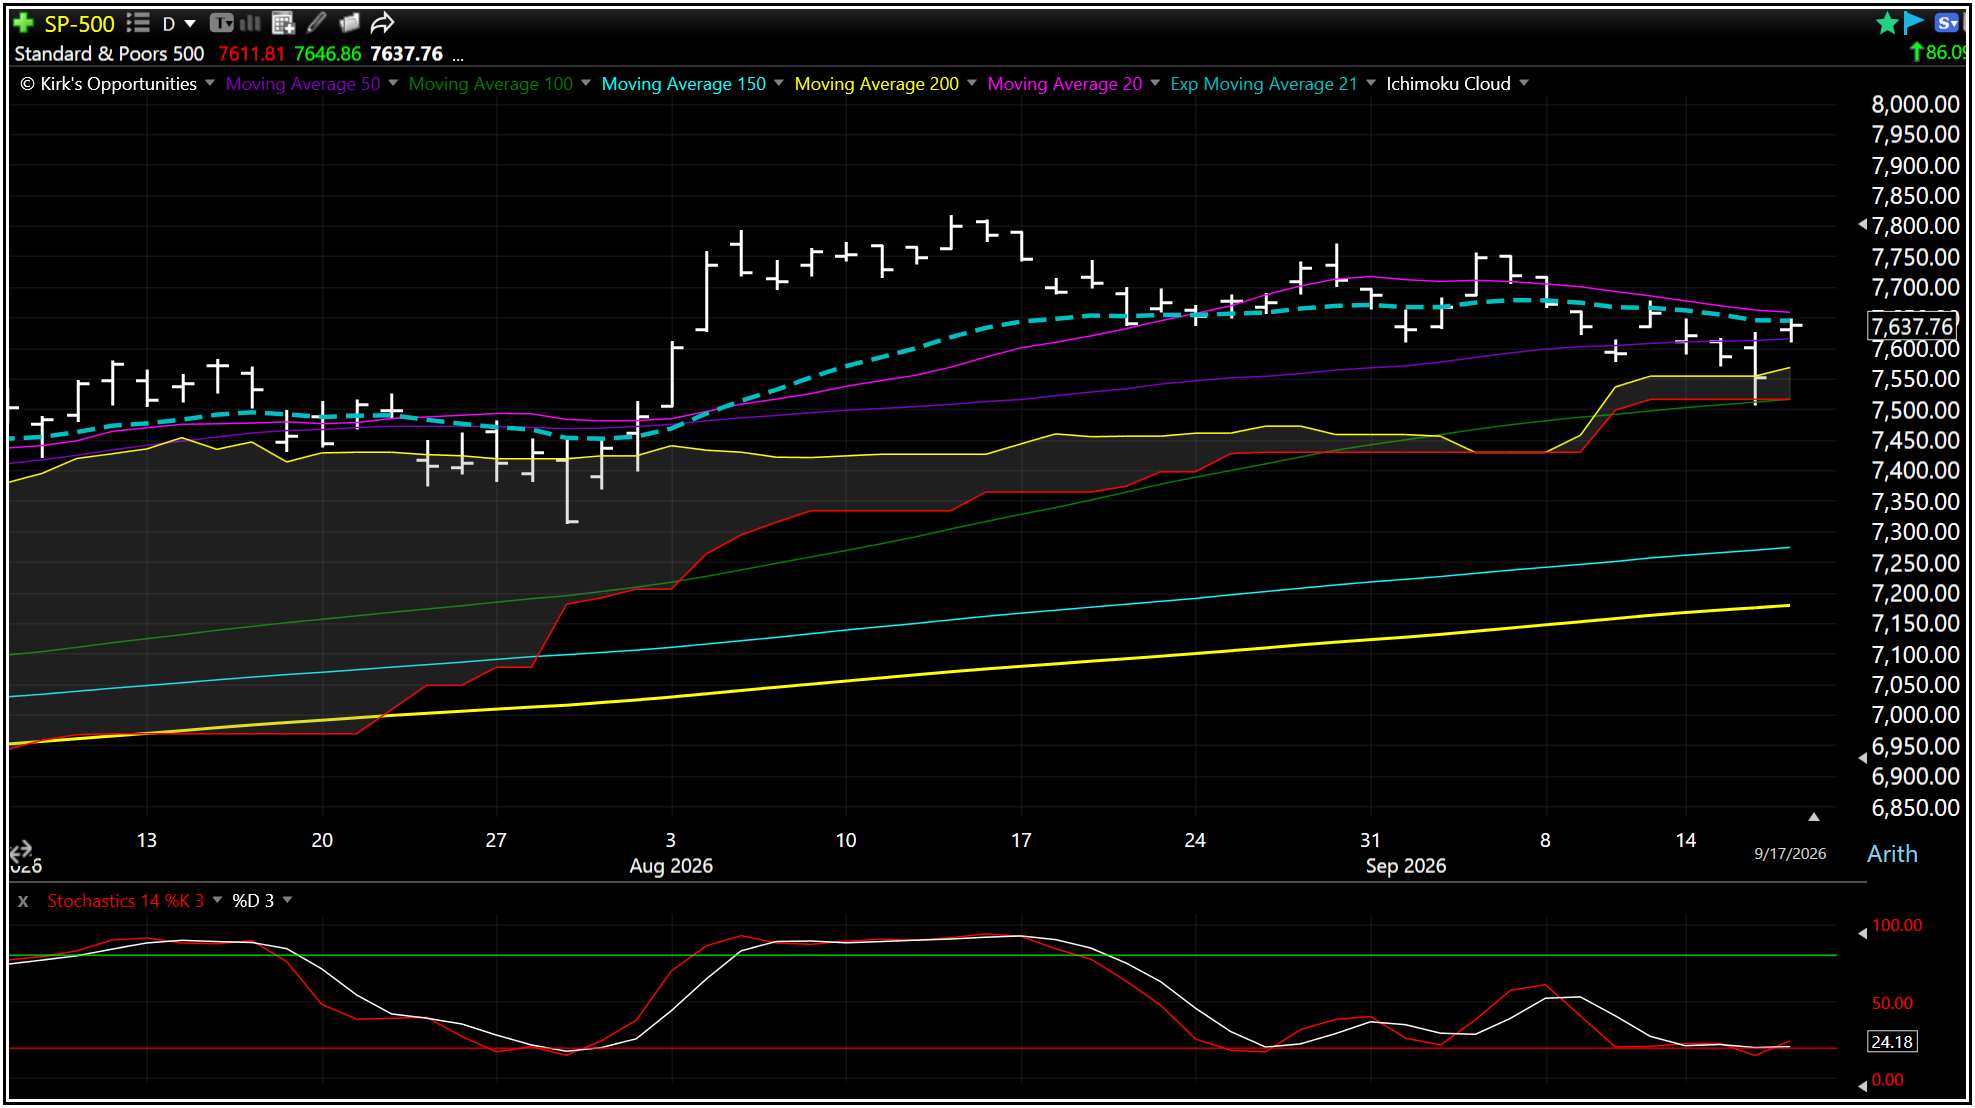
If THE low is already in (and I personally doubt that it is), a lot more upside follow through confirmation is required. After all, it is quite possible, too, that we could see an extended period of sideways movement within the longer-term uptrend. A move surely to frustrate the majority of impatient bulls and bears alike!
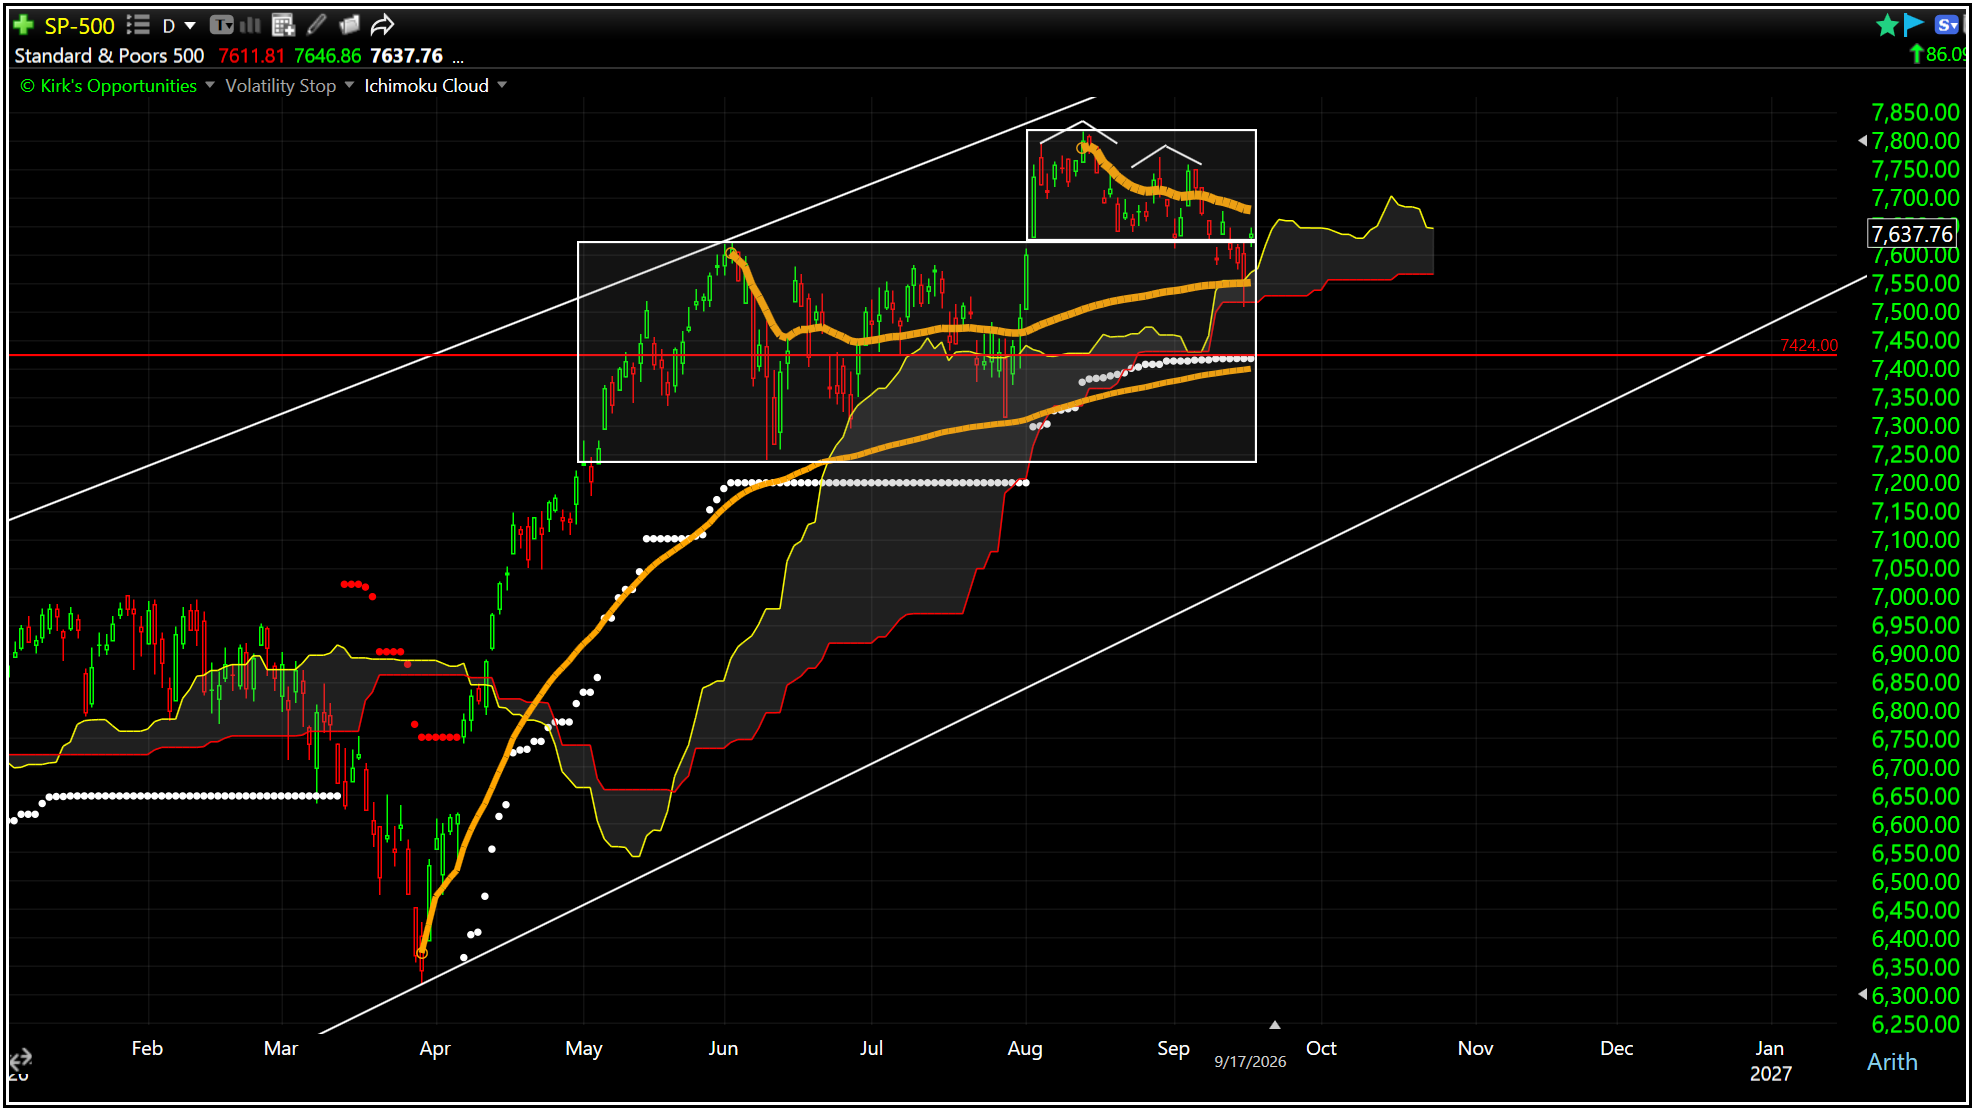
As for the bounce itself, one day moves like this fail to impress me.
What would impress?
For the series of short-term lower swing highs and lower swing lows to be broken and price retesting its prior high very quickly. To break this series, price would have to move above 775 in the SPY and 7756 in the S&P 500 itself.
It seems like a tall order in this environment.
THE TAPE
The Magnificent 7 (MAGS) and Fang+ (FNGS) are testing their recent highs.
This helped the Nasdaq Composite rally +1.69%, while the PHLX Semiconductor Index rose 3.1%.
Advancers outnumbered decliners roughly two-to-one on the NYSE and more than two-to-one on Nasdaq, on above-average volume.
Small and mid caps gained roughly 0.6%, while financials slipped.
Buyers returned broadly enough to improve participation, although technology remained well ahead of the rest.
BENEATH THE SURFACE
The index can hold up while its foundation weakens.
After breaking above its higher uptrend line, price has been in consolidation mode.
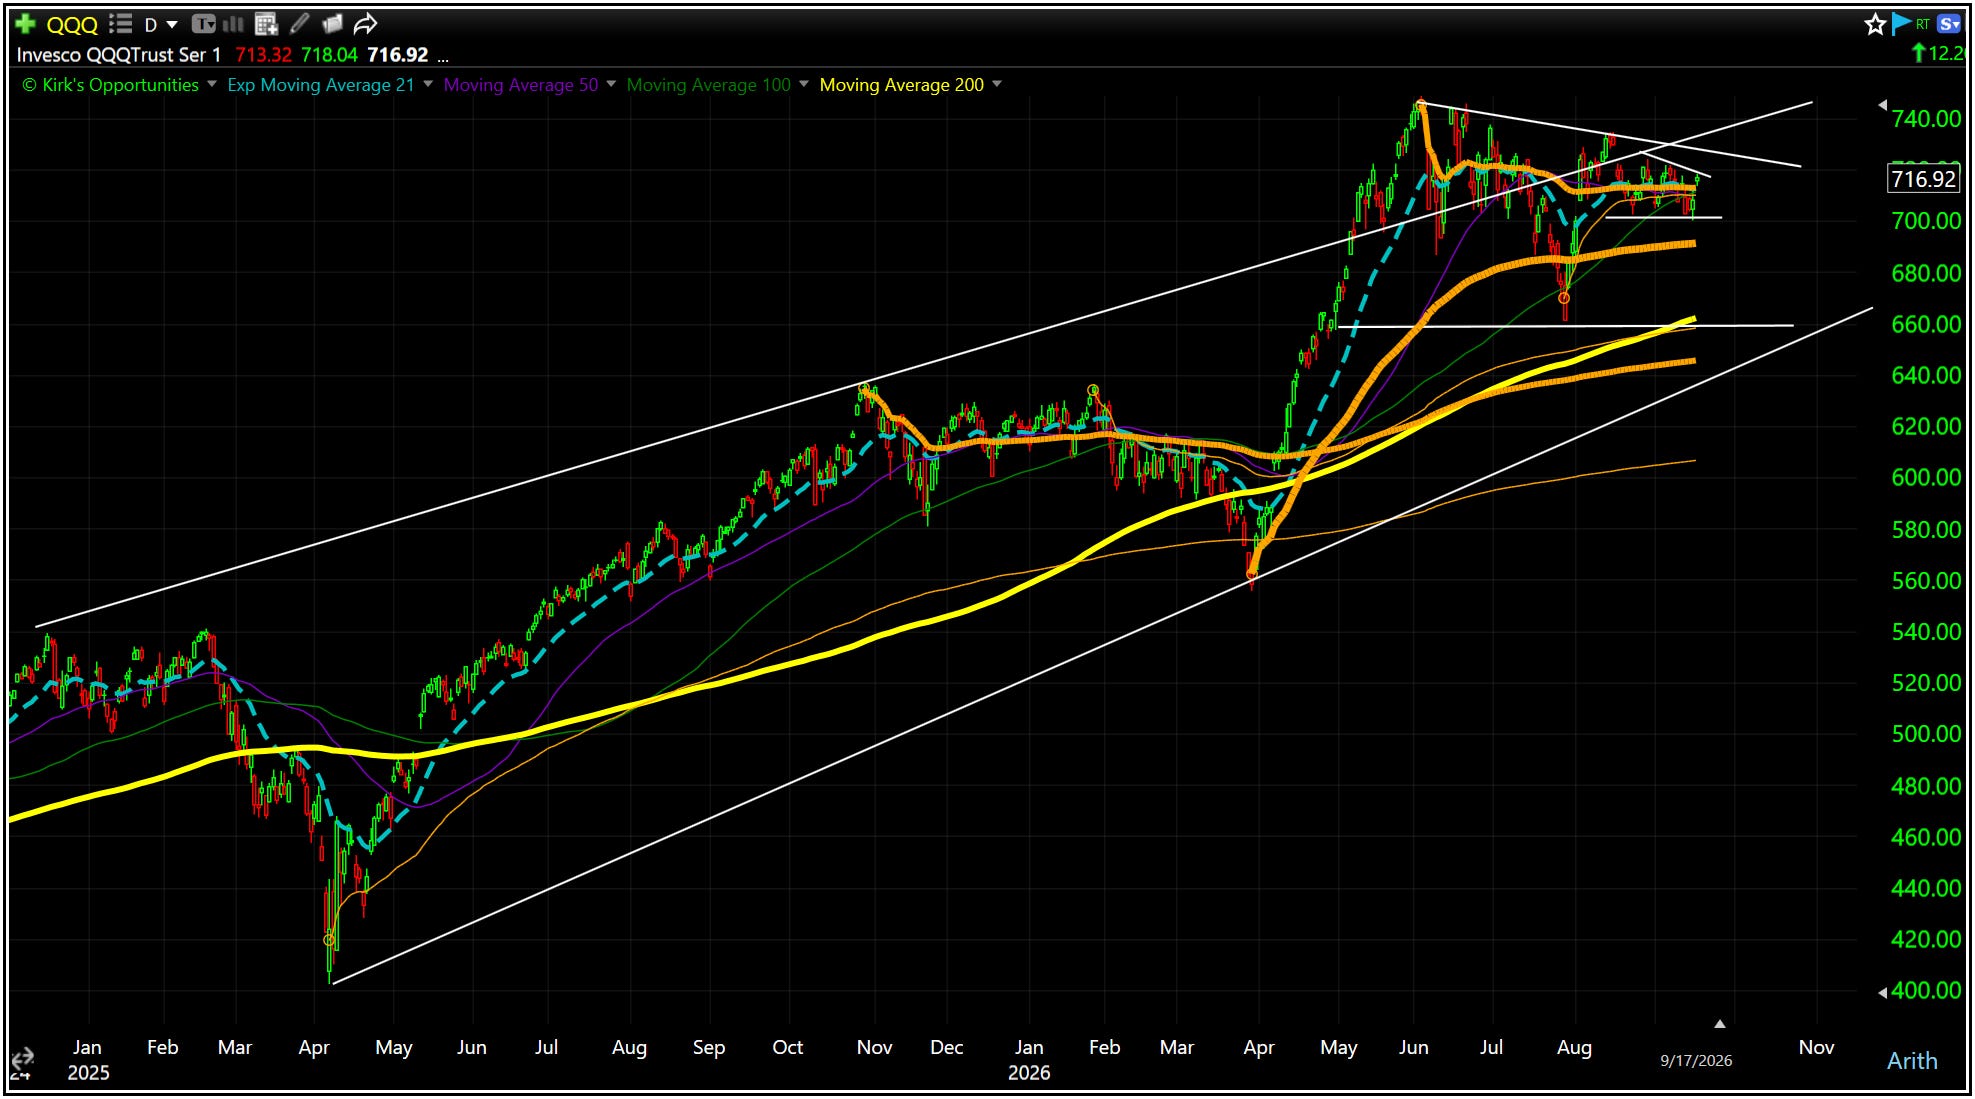
The Nasdaq 100 (QQQ) is roughly flat since mid-May, as the percentage of its stocks above their 200-day averages has fallen from 77% to 56%.
Some semiconductor stocks are approaching new highs while others struggle near long-term support. Which makes stock selection more demanding.
For bullish exposure, I’m more interested in names demonstrating strength (like we discussed yesterday) than in assuming the laggards must catch up.
Tops can develop gradually as stocks roll over in succession. A few leaders reaching new highs doesn’t settle which group is telling the larger story. We can watch whether strength spreads—or whether the remaining leaders eventually join the decline.
LEARN & GROW
The first reaction doesn’t have to become our final conclusion.
A useful framework around Fed days is often seen as this:
Day 1 (Wednesday) brings the initial reaction
Day 2 (today) brings the reaction to that reaction
Day 3 (Friday) starts revealing what may endure
With triple witching expiration tomorrow, it will be interesting to see whether today’s oversold bounce has any further follow through given the tendency to see strength sold into the second half of September which tends to see weakness.
MIXER
Yield & Oil watch: The 10-year yield settled near 4.95%, while WTI finished at $102.03, down just 0.4% after recovering from its intraday low. The Bank of Japan decision will add another wrinkle in yields tomorrow.
Breadth check: More than half of Russell 1000 stocks were below their 200-day averages Wednesday, even though the index itself was nowhere near historically oversold territory. The headline decline, as so often has been the case, clearly understates how many individual trends have weakened.
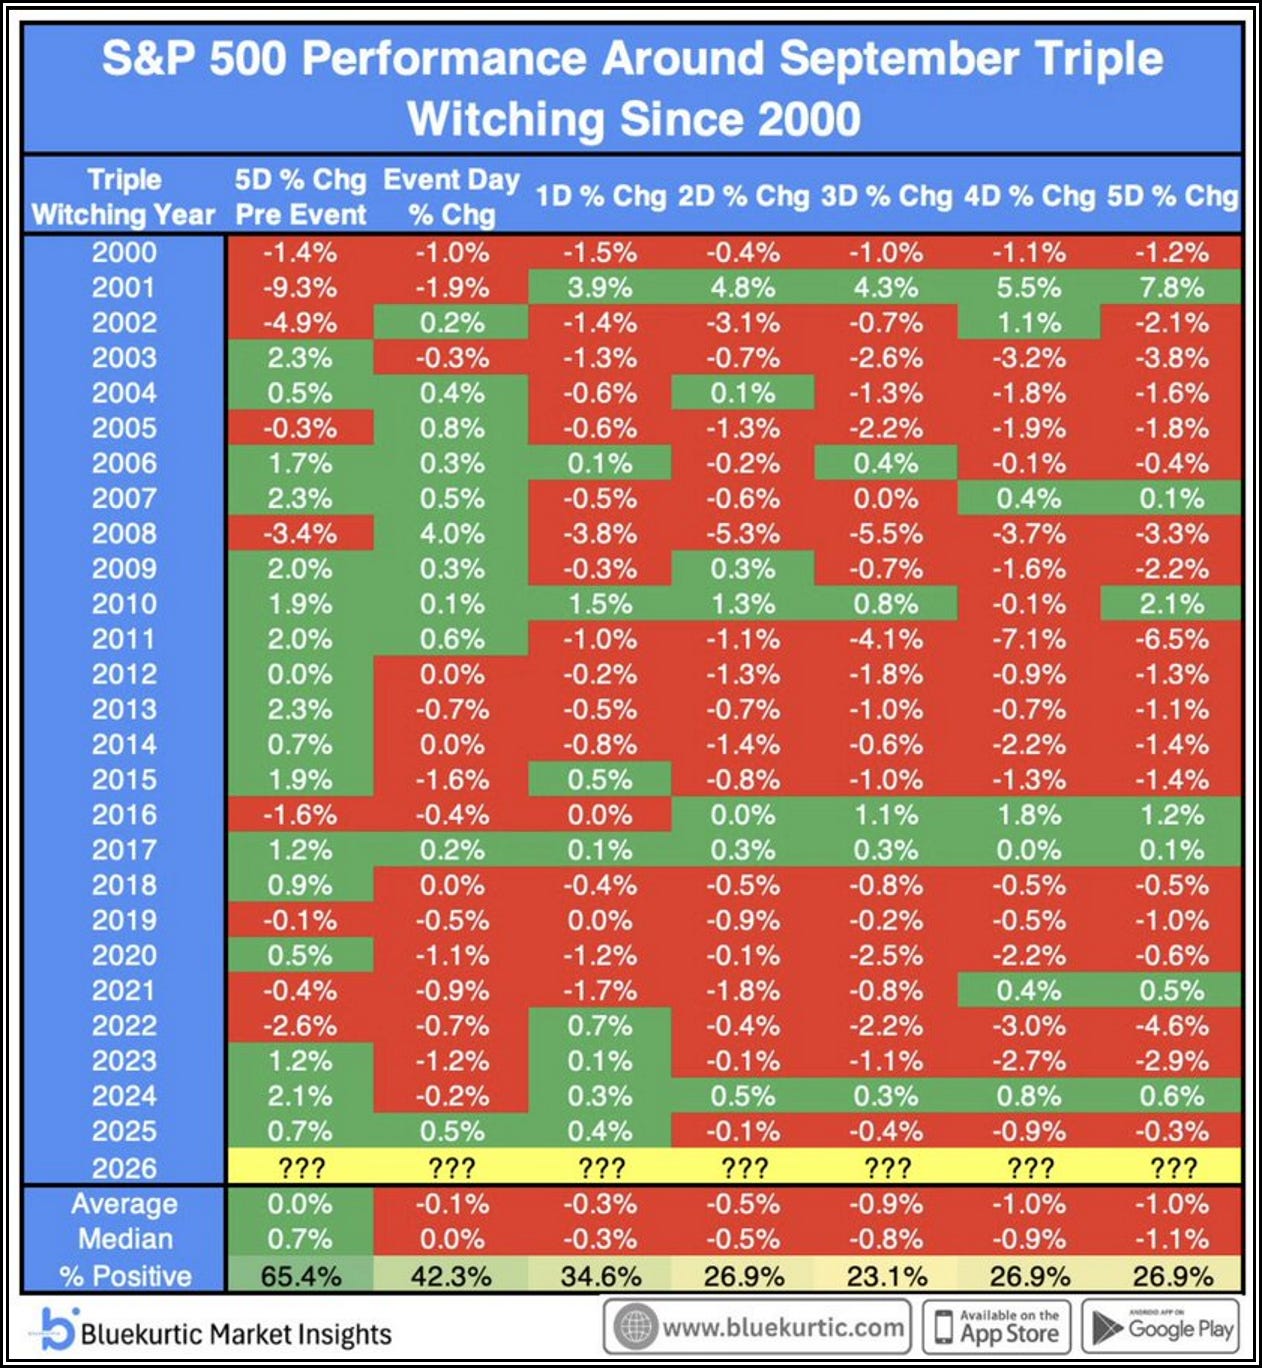
September witching: More than $2 trillion in estimated delta-adjusted options notional is expiring tomorrow. The following September expiration study shows declines on triple-witching day in 12 of 14 cases from 2012–2025. Beginning in 2000, the S&P 500 was positive only 26.9% of the time over the following five trading days. Therefore, if price continues the bounce tomorrow, it will be overcoming these negative patterns as well.
YOUR TURN
The best indicator on how aggressive to be is to watch your watchlist.
Are most participating or staying sidelined or getting even weaker?
Often you’ll be able to tell so much more by watching your portfolio and watchlist than the major indexes.
TO TAKE WITH YOU
The next pullback may be the most useful part of this bounce. If buyers defend a higher low, we’ll have a clearer place to act and a clearer place to be wrong.
MEMBERS ONLY
Tonight I share a lesson on how I treat the entry of a new position: