


My friends, stocks continued their summer melt up last week.
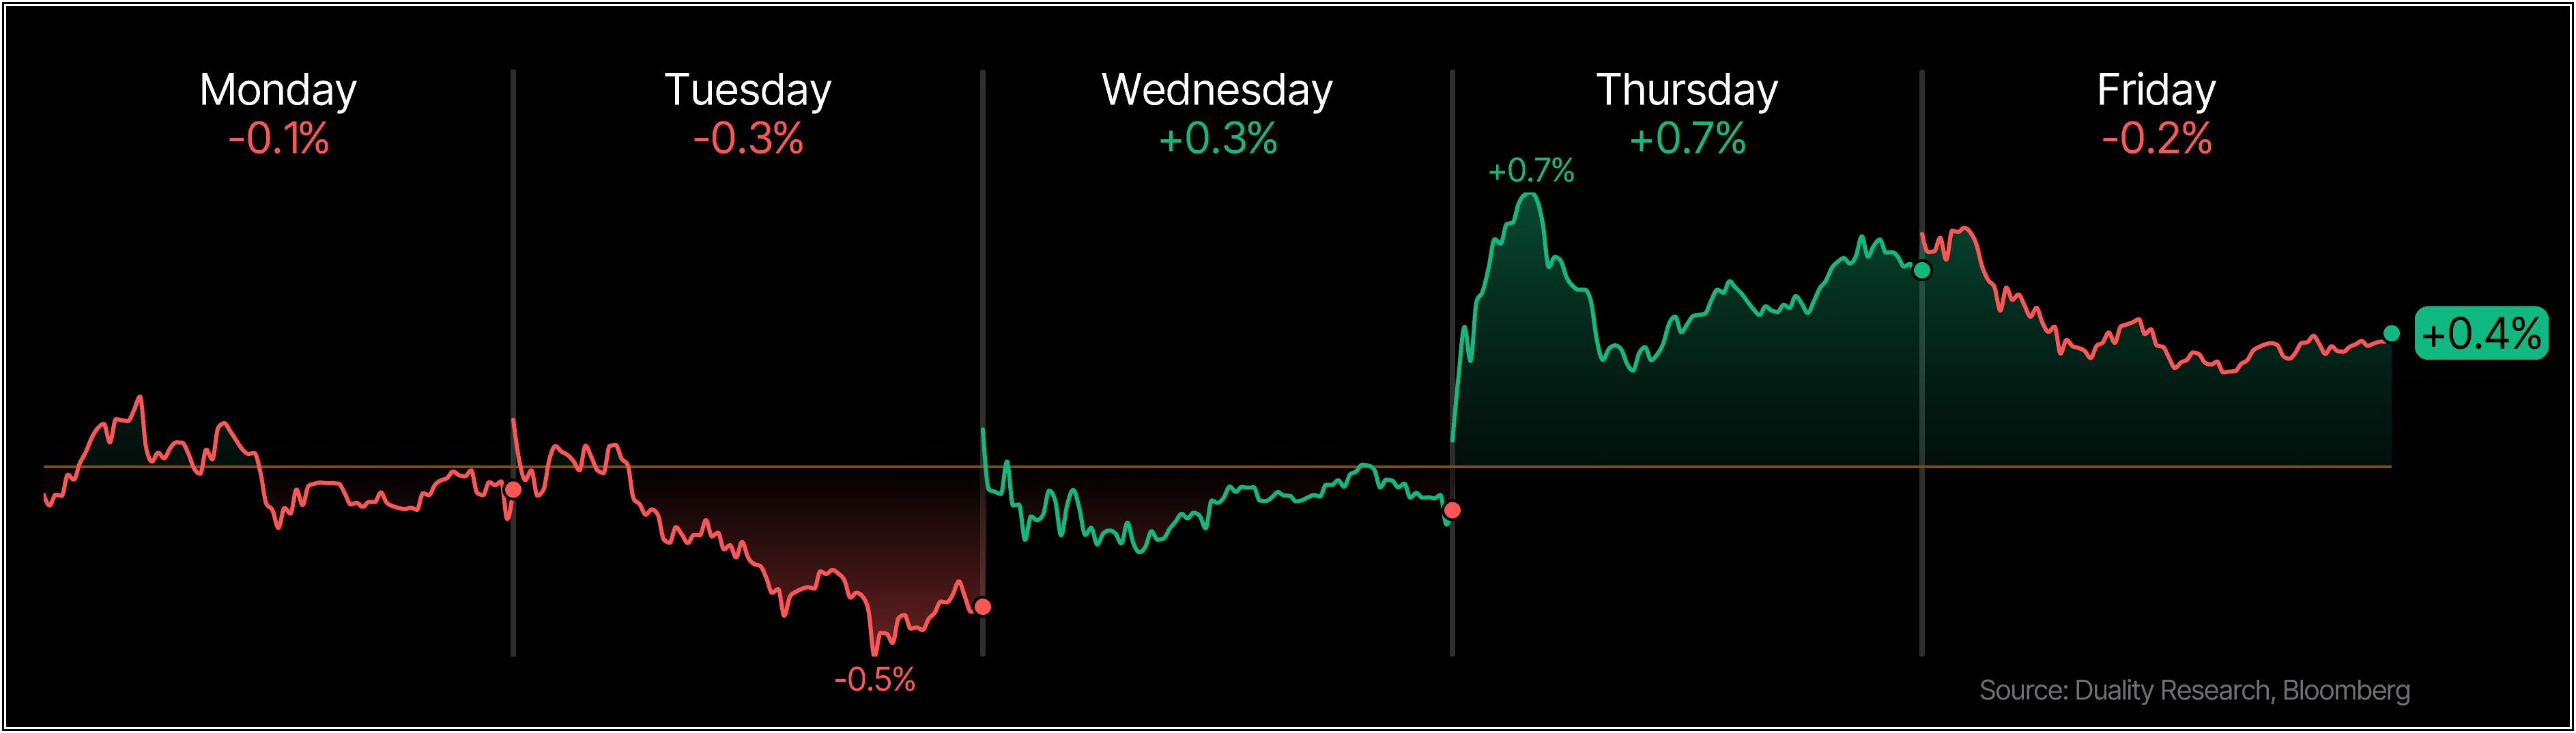
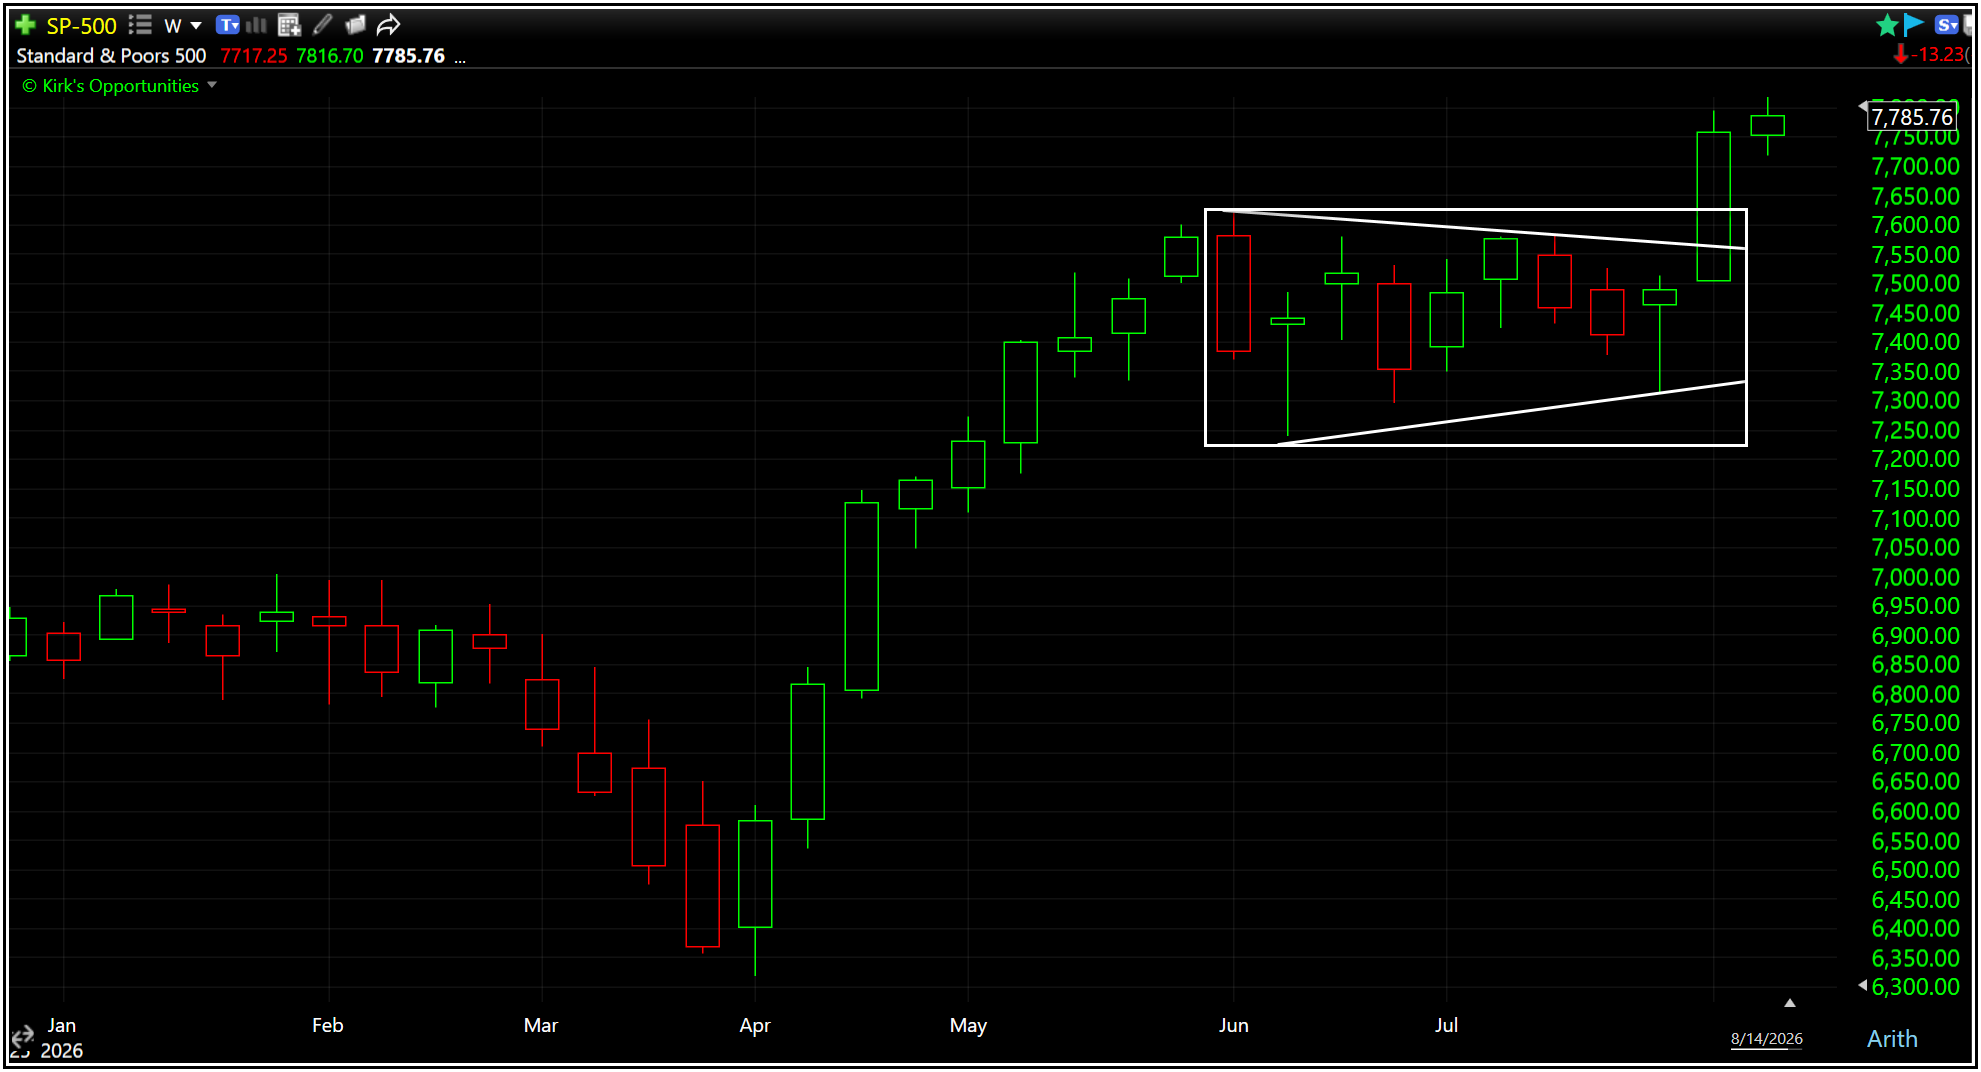
For the S&P 500, it was the third straight positive week, breaking the pattern of two up weeks followed by one or two down weeks that had kept price trapped within its range.
More importantly, the S&P 500 is beginning to see the bullish follow through we wanted from the prior week’s breakout, ending more than +2% above its June 2nd high.
As with all breakouts from trading ranges, the stronger the follow through toward its breakout targets at 7925 and 8003, the better.
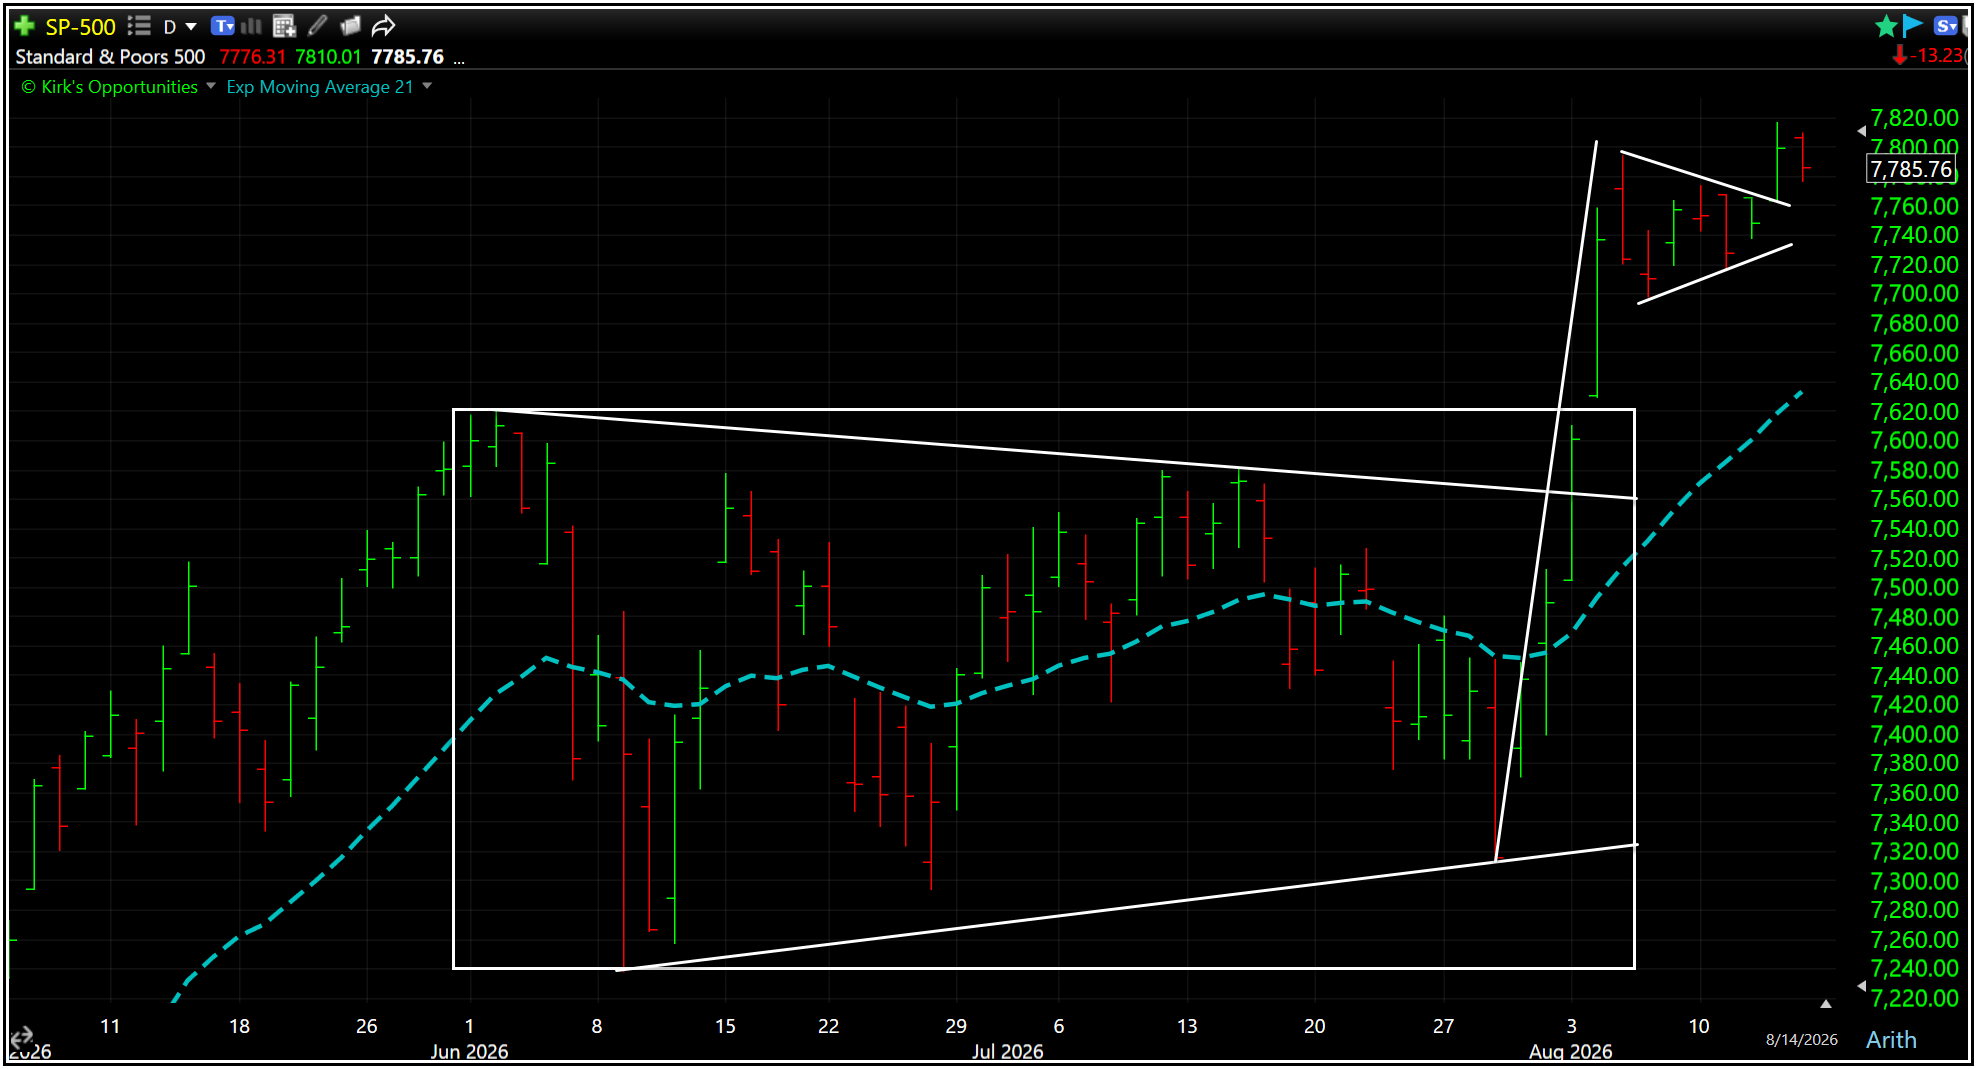
On the short-term daily view, we can see the range breakout has taken the form of a bull flag breakout.
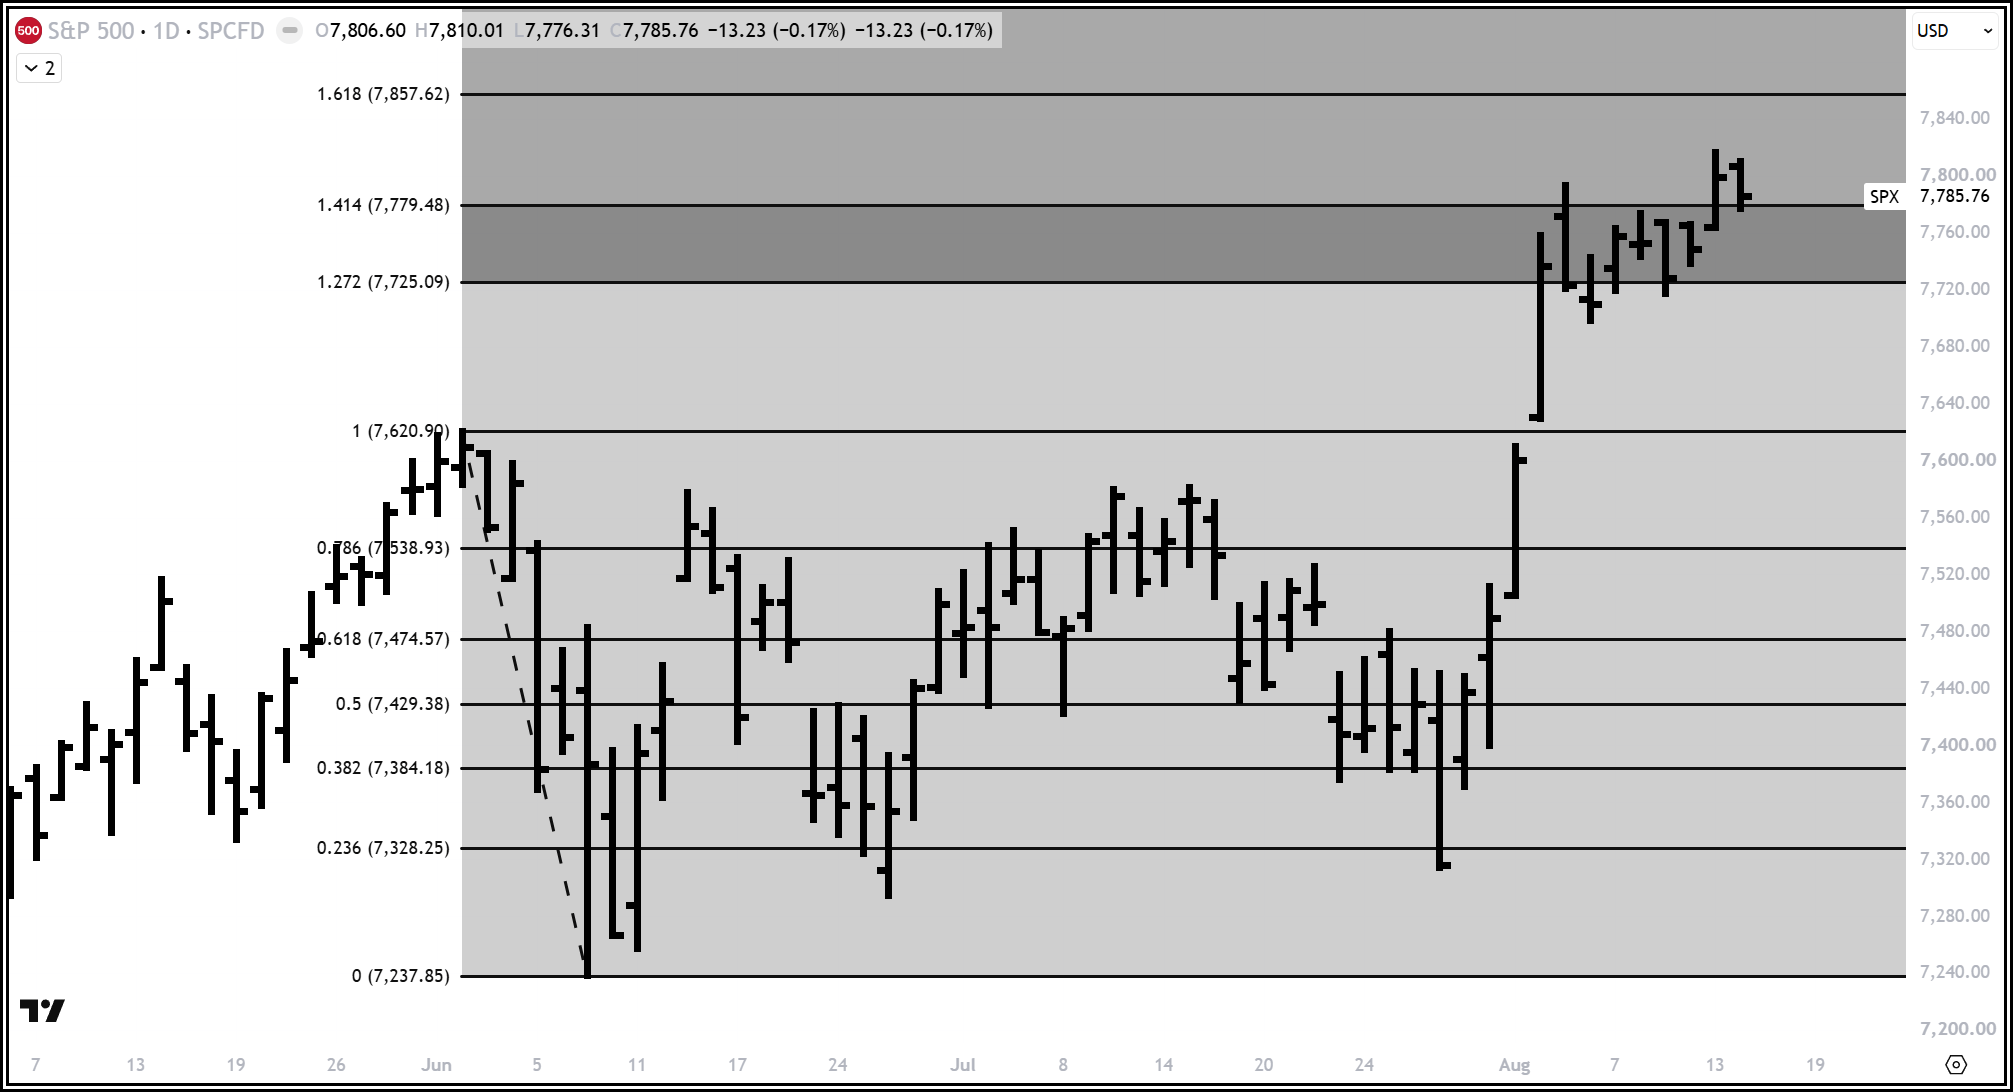
This new short-term play provides two additional targets at 8178 and 8273 if there is strong and sustained follow through.
There’s one catch.
At this point, we have only the trigger day from Thursday and no additional closes higher, so this new bull flag is not yet confirmed.
This will be a priority to watch this week.
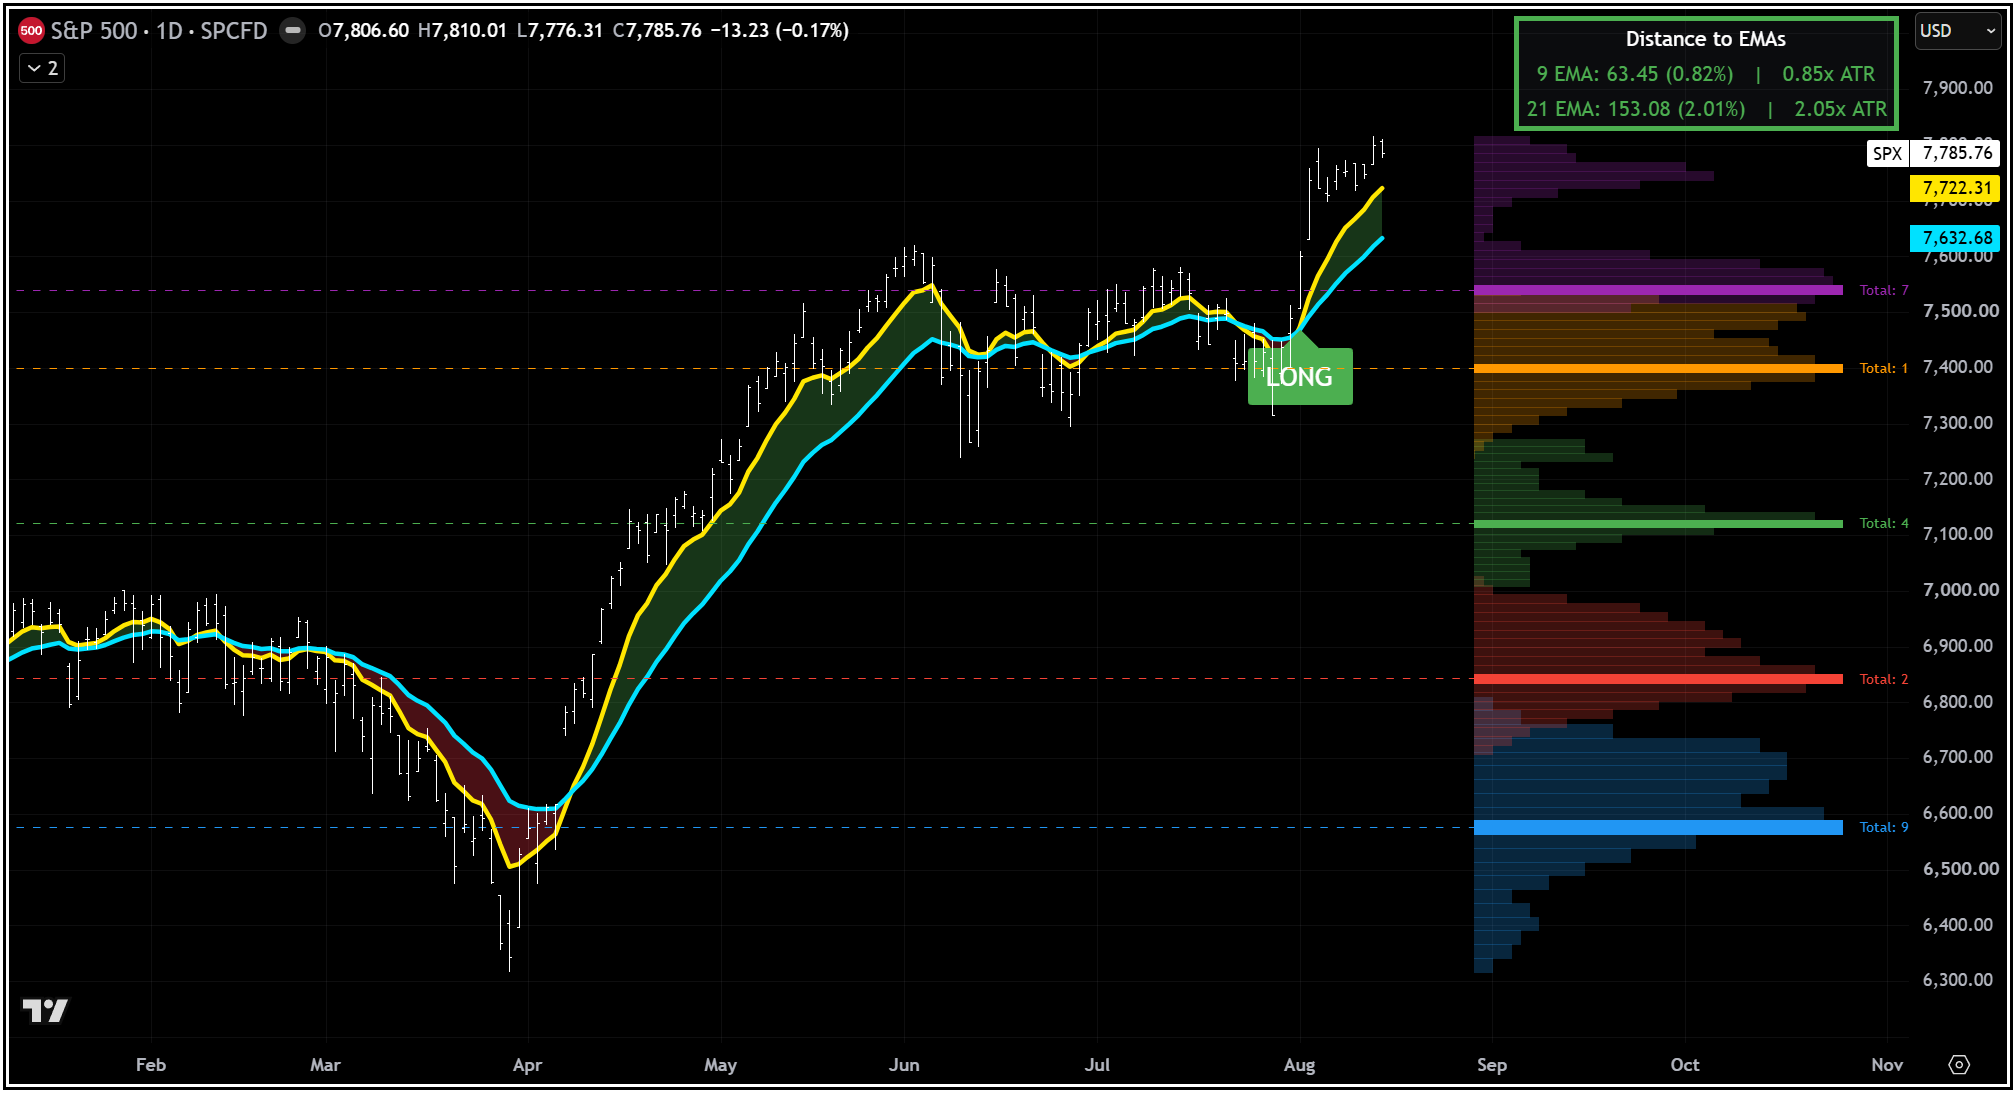
A bull flag failure could quickly put the 21EMA into play, along with the large unfilled gap near 7600 left behind by the August 4th breakaway.
That would turn what currently looks bullish into a failed bull flag, bull trap and potentially a much deeper throwback retest.
At the same time, the first target, the Fibonacci extension at 7857, is now less than 1% away. The market doesn’t have to travel very far before giving us another answer.
As encouraged as we are by the improvement in price action over the past three weeks, we cannot discount a throwback scenario from playing out.
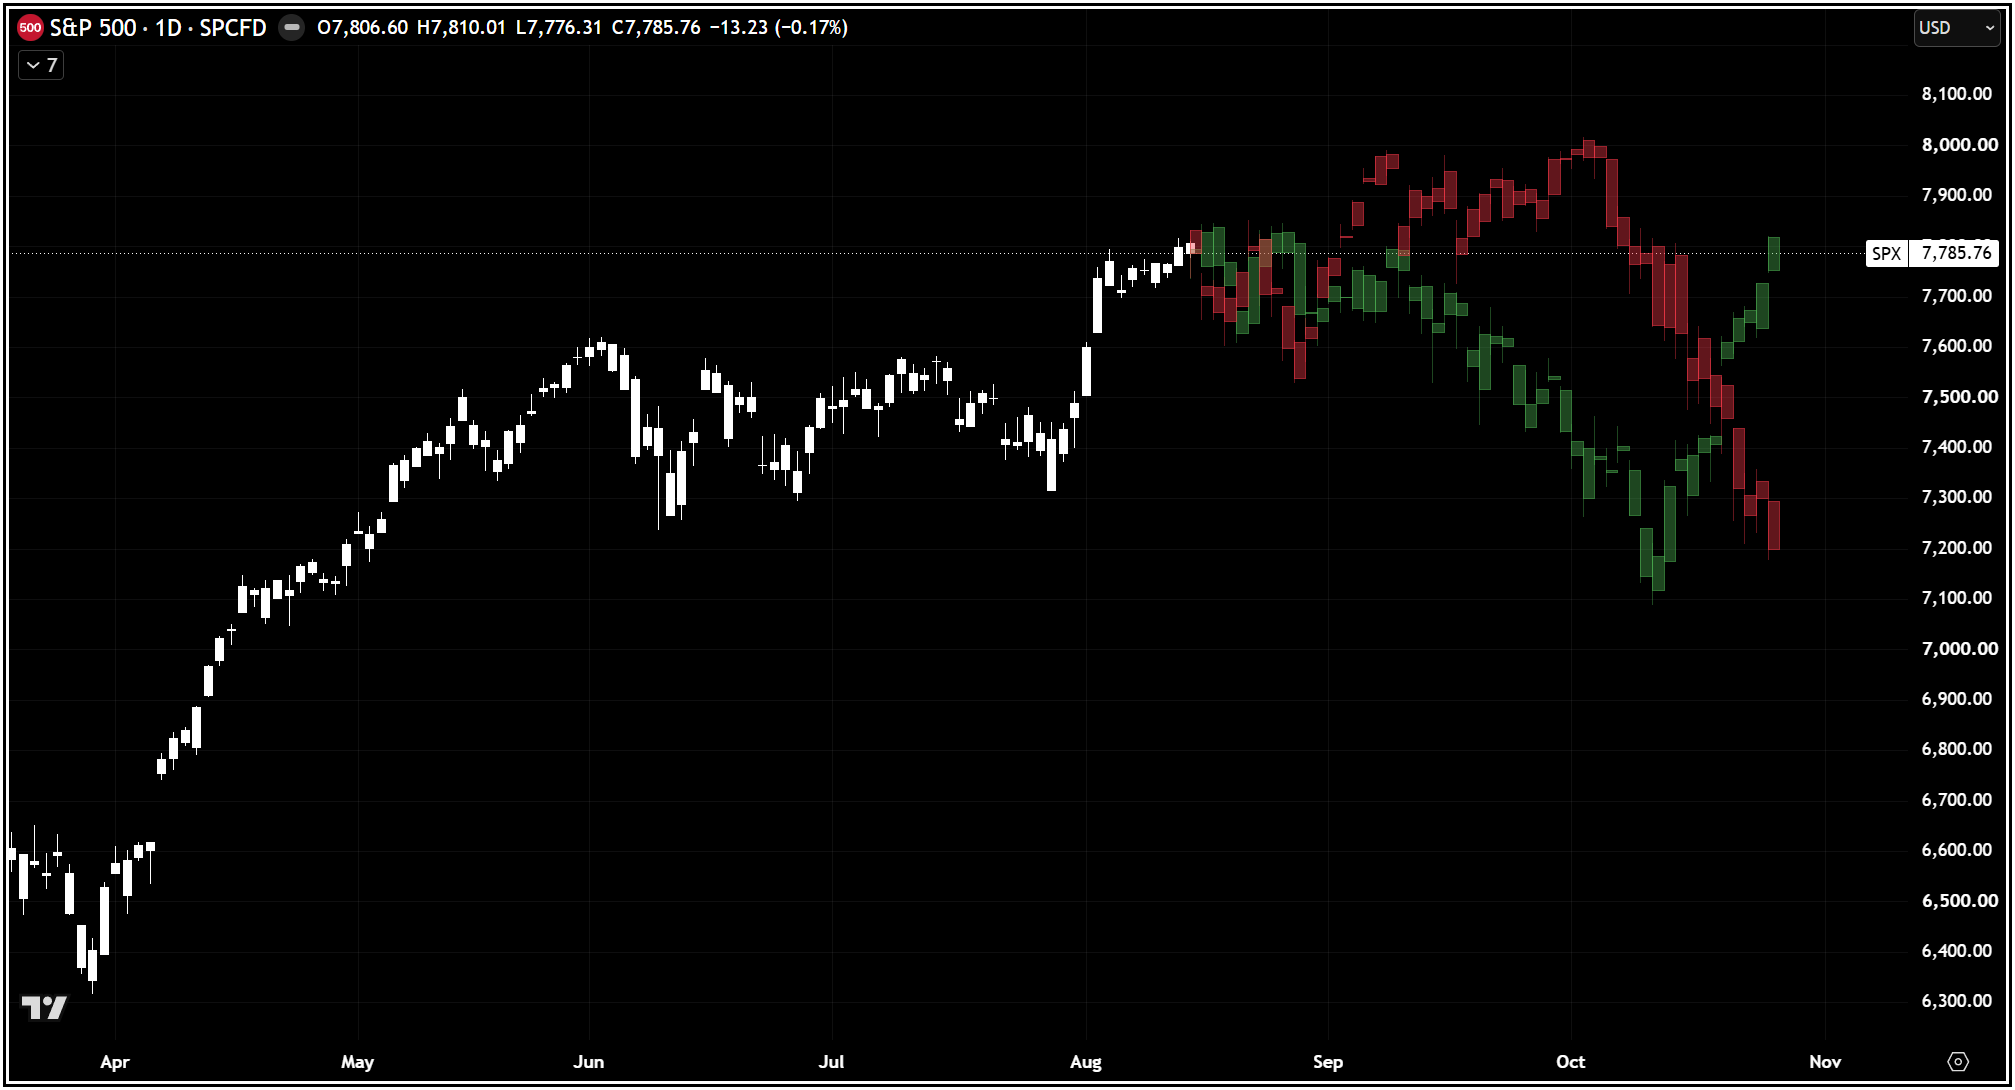
Some of the forward correlation studies I have shared indicate the path ahead may prove considerably more volatile and challenging than the remarkably calm price action of the past few weeks would suggest.
Note the two divergent pathways, including potential trap moves within both the bullish and bearish scenarios.
Markets rarely make it as easy as the straight-line forecast suggests.
Within my own charting, I have also updated the longer-term framework using two narrowing trendlines drawn from the two major highs and lows over the past year.
The next three targets remain inside this larger wedge, while the final two sit above it.
Eventually one of those trendlines is going to give way.
When it does, price will be sending us another message.
We’ll be watching both boundaries as we navigate the remainder of the year.
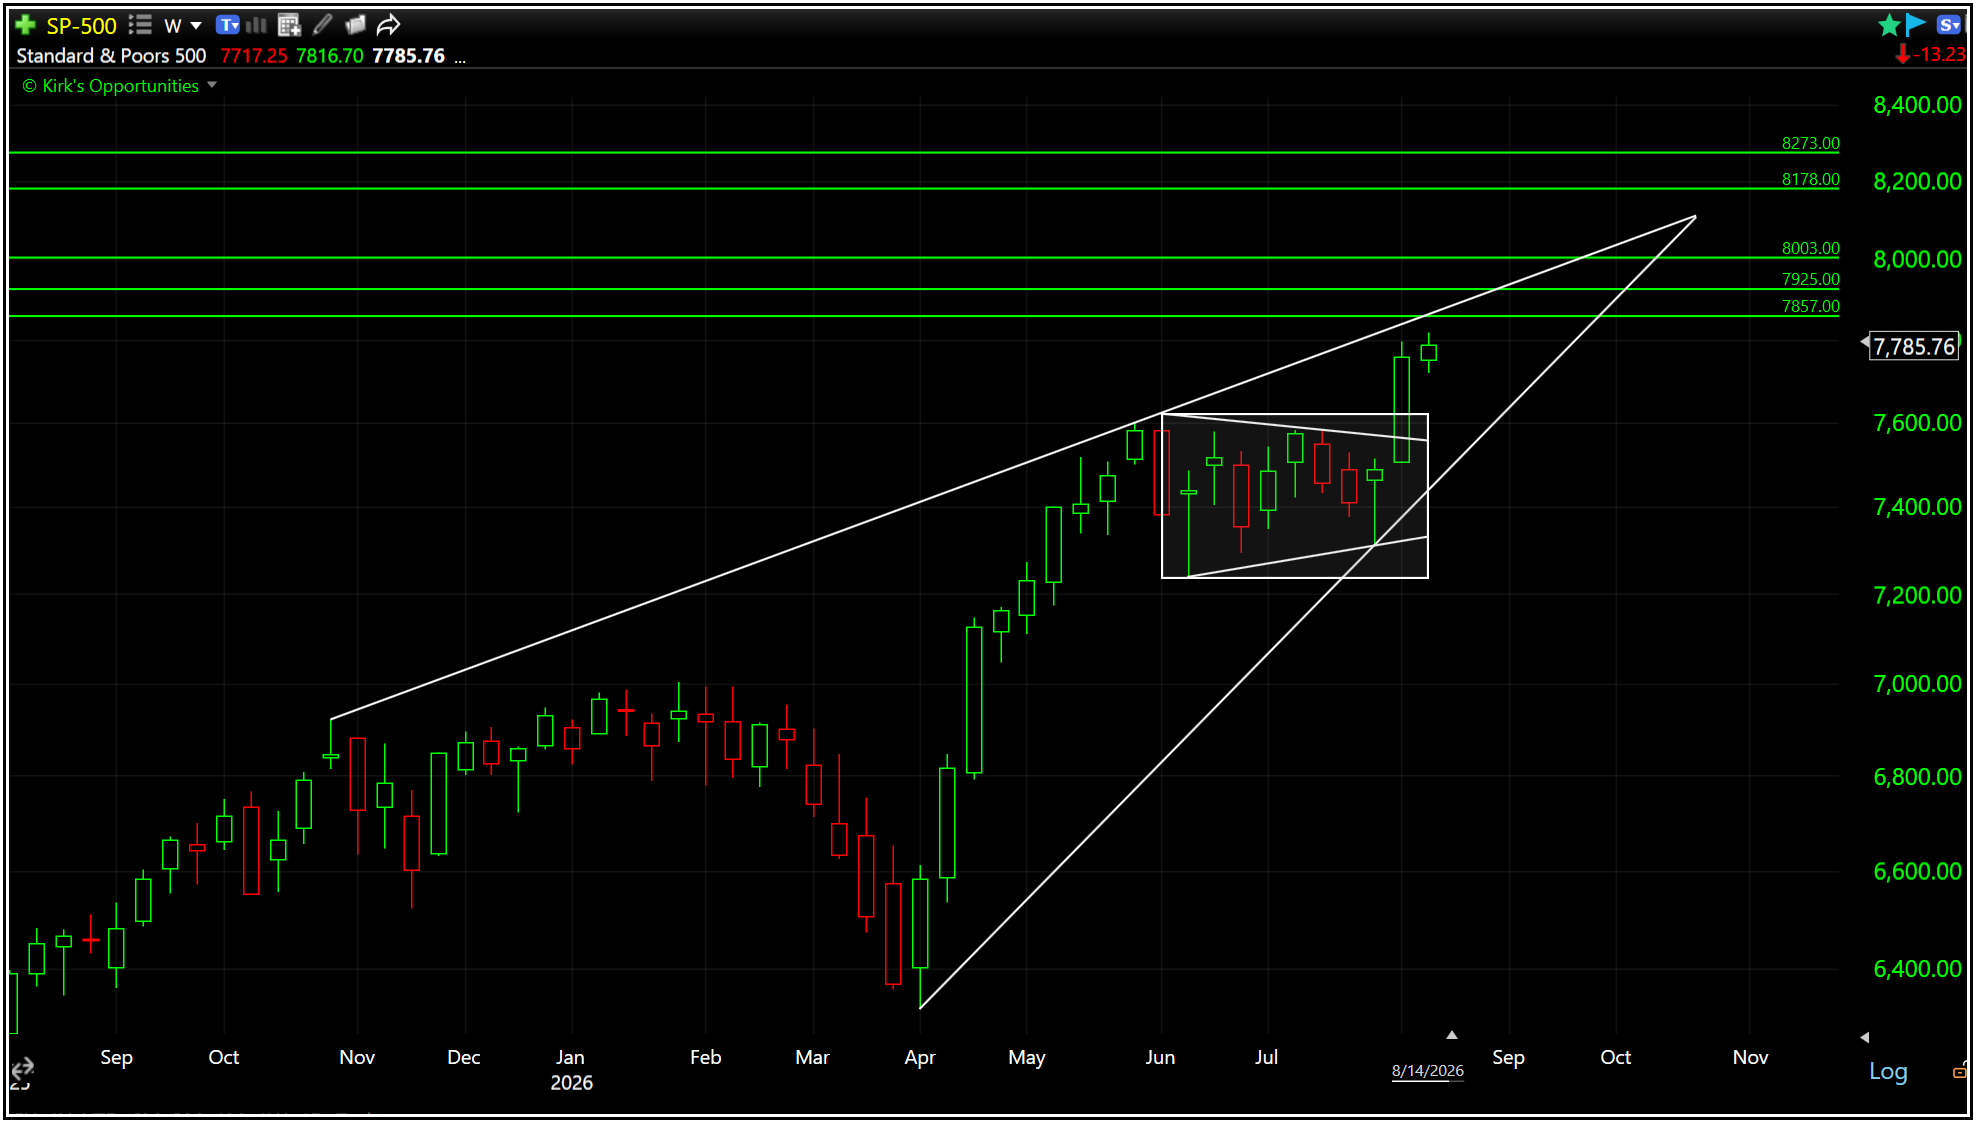
We now have five targets in play at S&P 7857, 7925, 8003, 8178 and 8273.
The highest target at 8273 is +6.26% above Friday’s close. A throwback move is approximately -2.12% lower.
On the percentages alone, that is an attractive risk/reward setup.
6.26 ÷ 2.12 = 2.95-to-1, essentially 3:1 reward/risk.
That means risking roughly $1 for the possibility of making $2.95. Mathematically, a setup with that payoff would need to work only about 25% of the time to break even before considering gaps, slippage, commissions or imperfect exits.
Yes, this is the kind of asymmetry worth paying attention to.
As my long-term members will remember, when we have numerous upside targets simultaneously in play, the probability of the trend extending higher for longer has generally been favorable until price tells us otherwise.
Right now, price hasn’t proved otherwise.
Collectively, these price-action plays continue to provide a bullish short- and longer-term foundation for additional highs.
As I’ve shared in my notes, every swing strategy I currently use is on a buy signal.
Most, but not all, are now shifting into confirmed buy-signal conditions following last week’s additional upside follow through.
Those that have not yet confirmed don’t need much more.
A little additional sustained strength would do it.
In other words, the probabilities favor this breakout continuing.
But favorable probabilities can still get better.
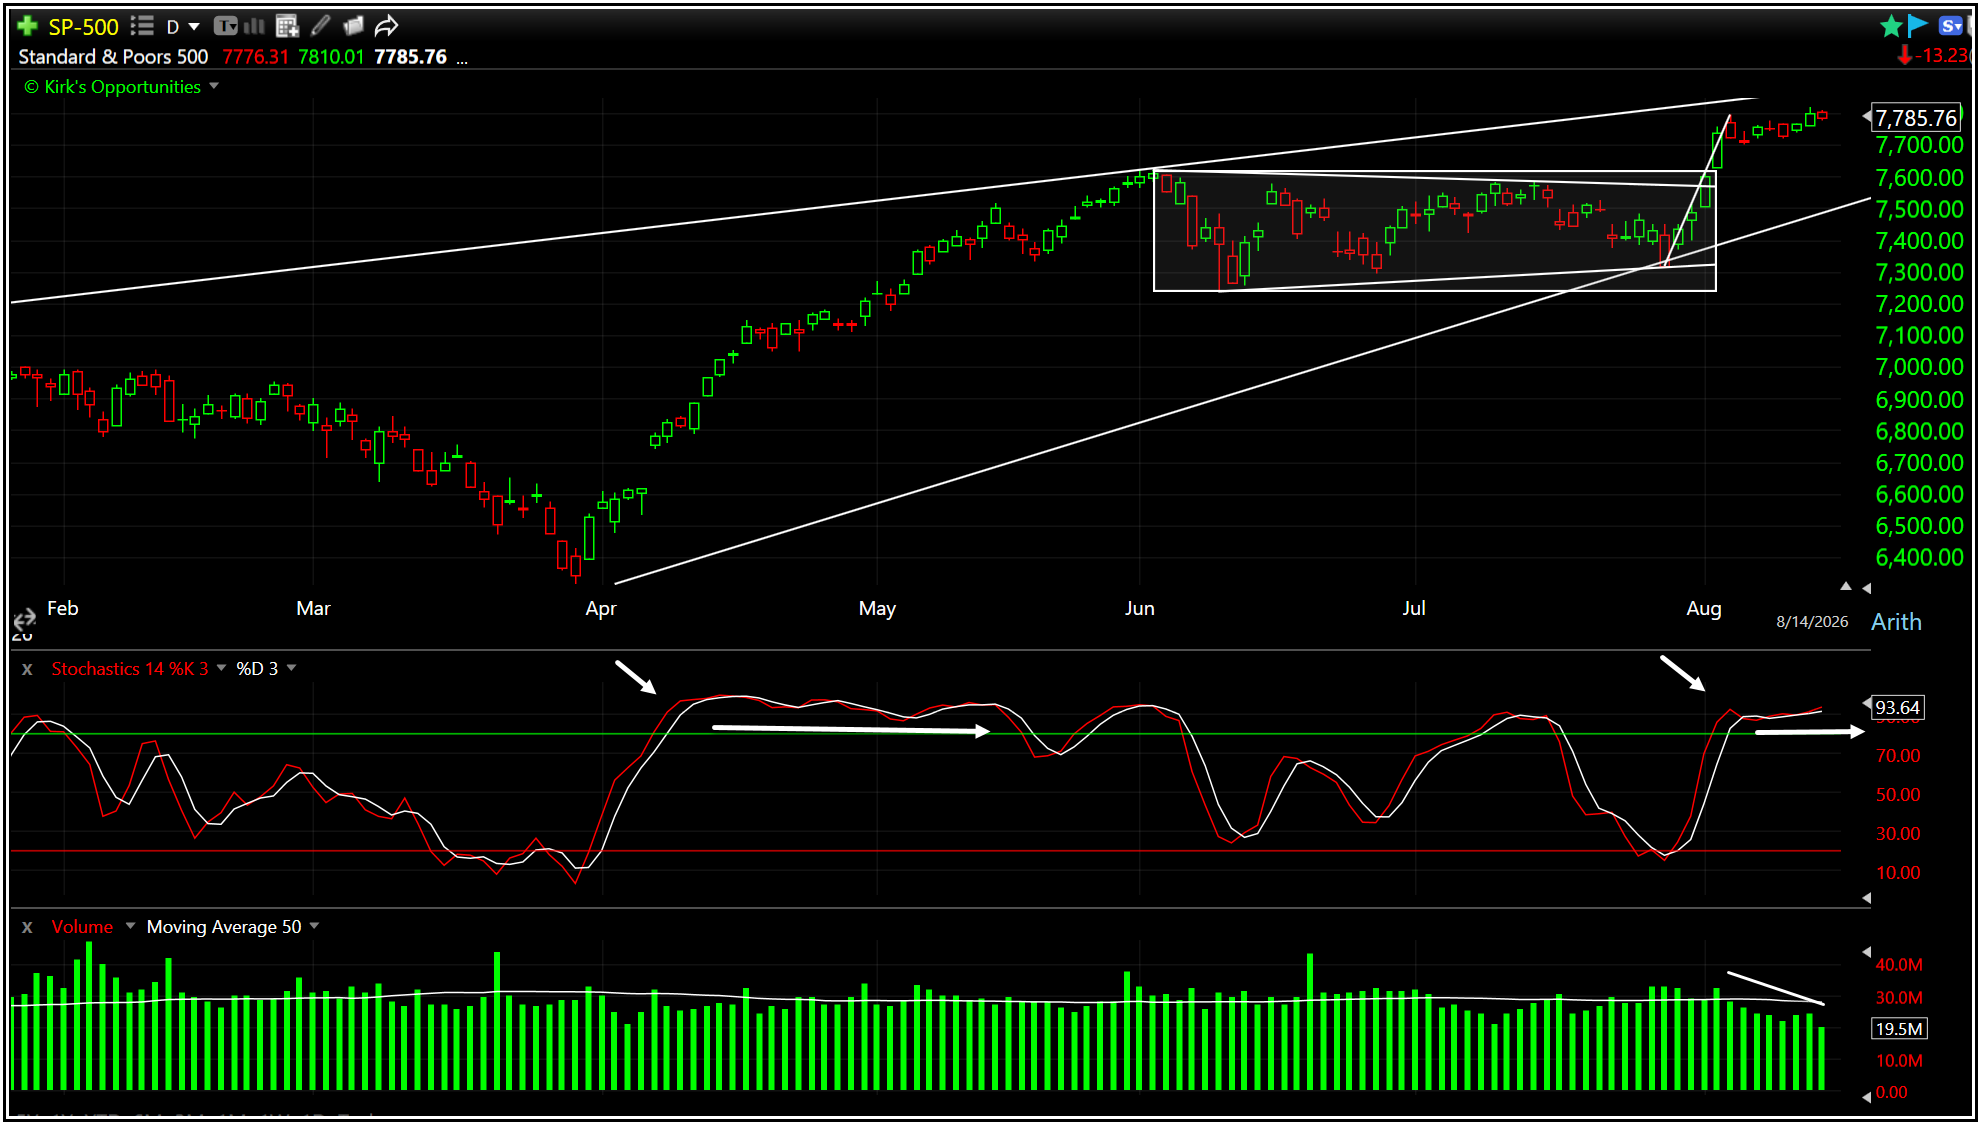
The S&P 500 also remained in a stochastically overbought condition throughout last week, which is something I like to see during a strong trend.
Strong markets can remain overbought far longer than most investors expect.
Holding an overbought condition for longer, rather than seeing strength immediately sold into as occurred during the second half of July, would be another positive indication.
On the flip side, summer volume remained light, placing at least a small question mark over the sustainability of the breakaway.
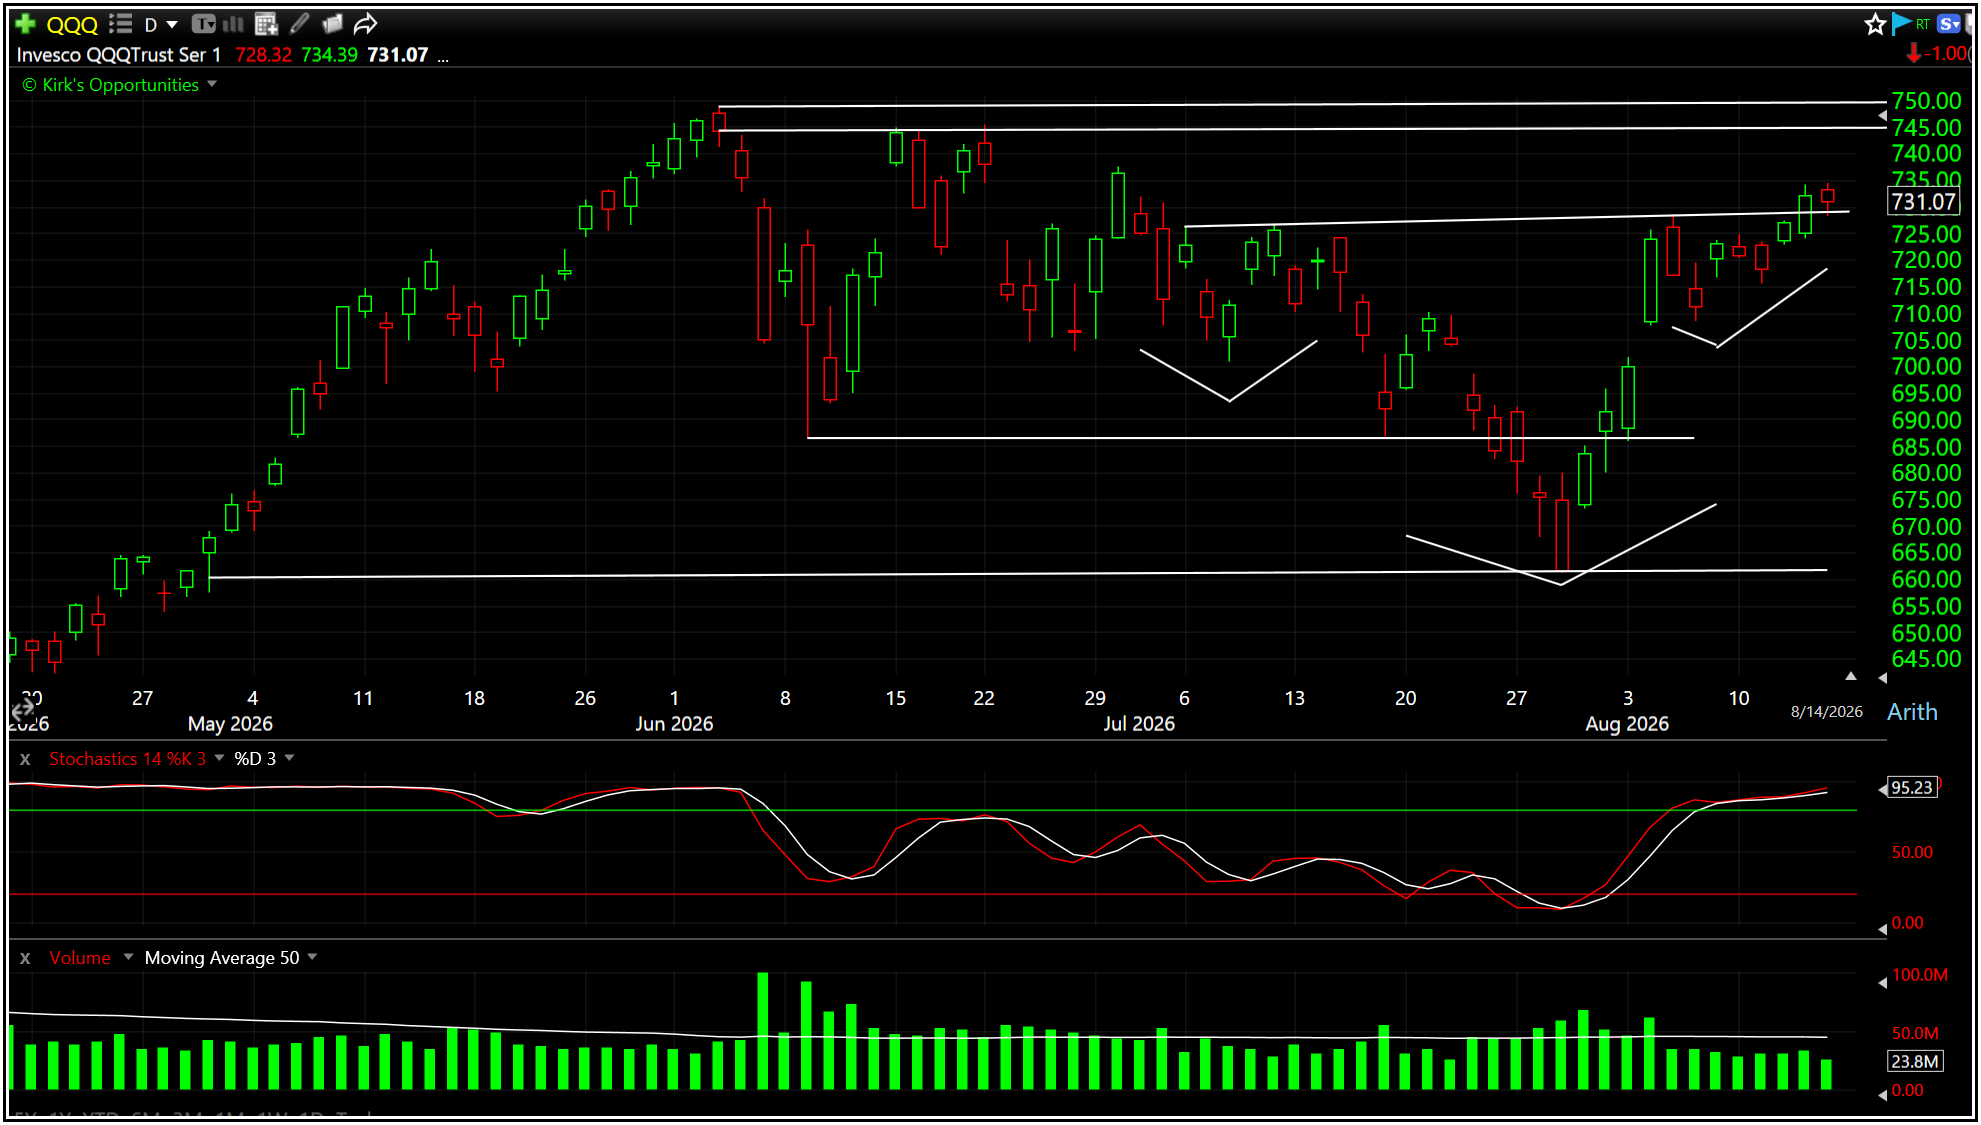
Much like the S&P 500, the Nasdaq 100 (QQQ) produced encouraging price action.
Price has not yet broken above its June high, but another bullish reversal play has developed within the range, targeting approximately $791, roughly +8% above Friday’s close.
Now we watch for follow through or failure. No need to guess which one comes first.
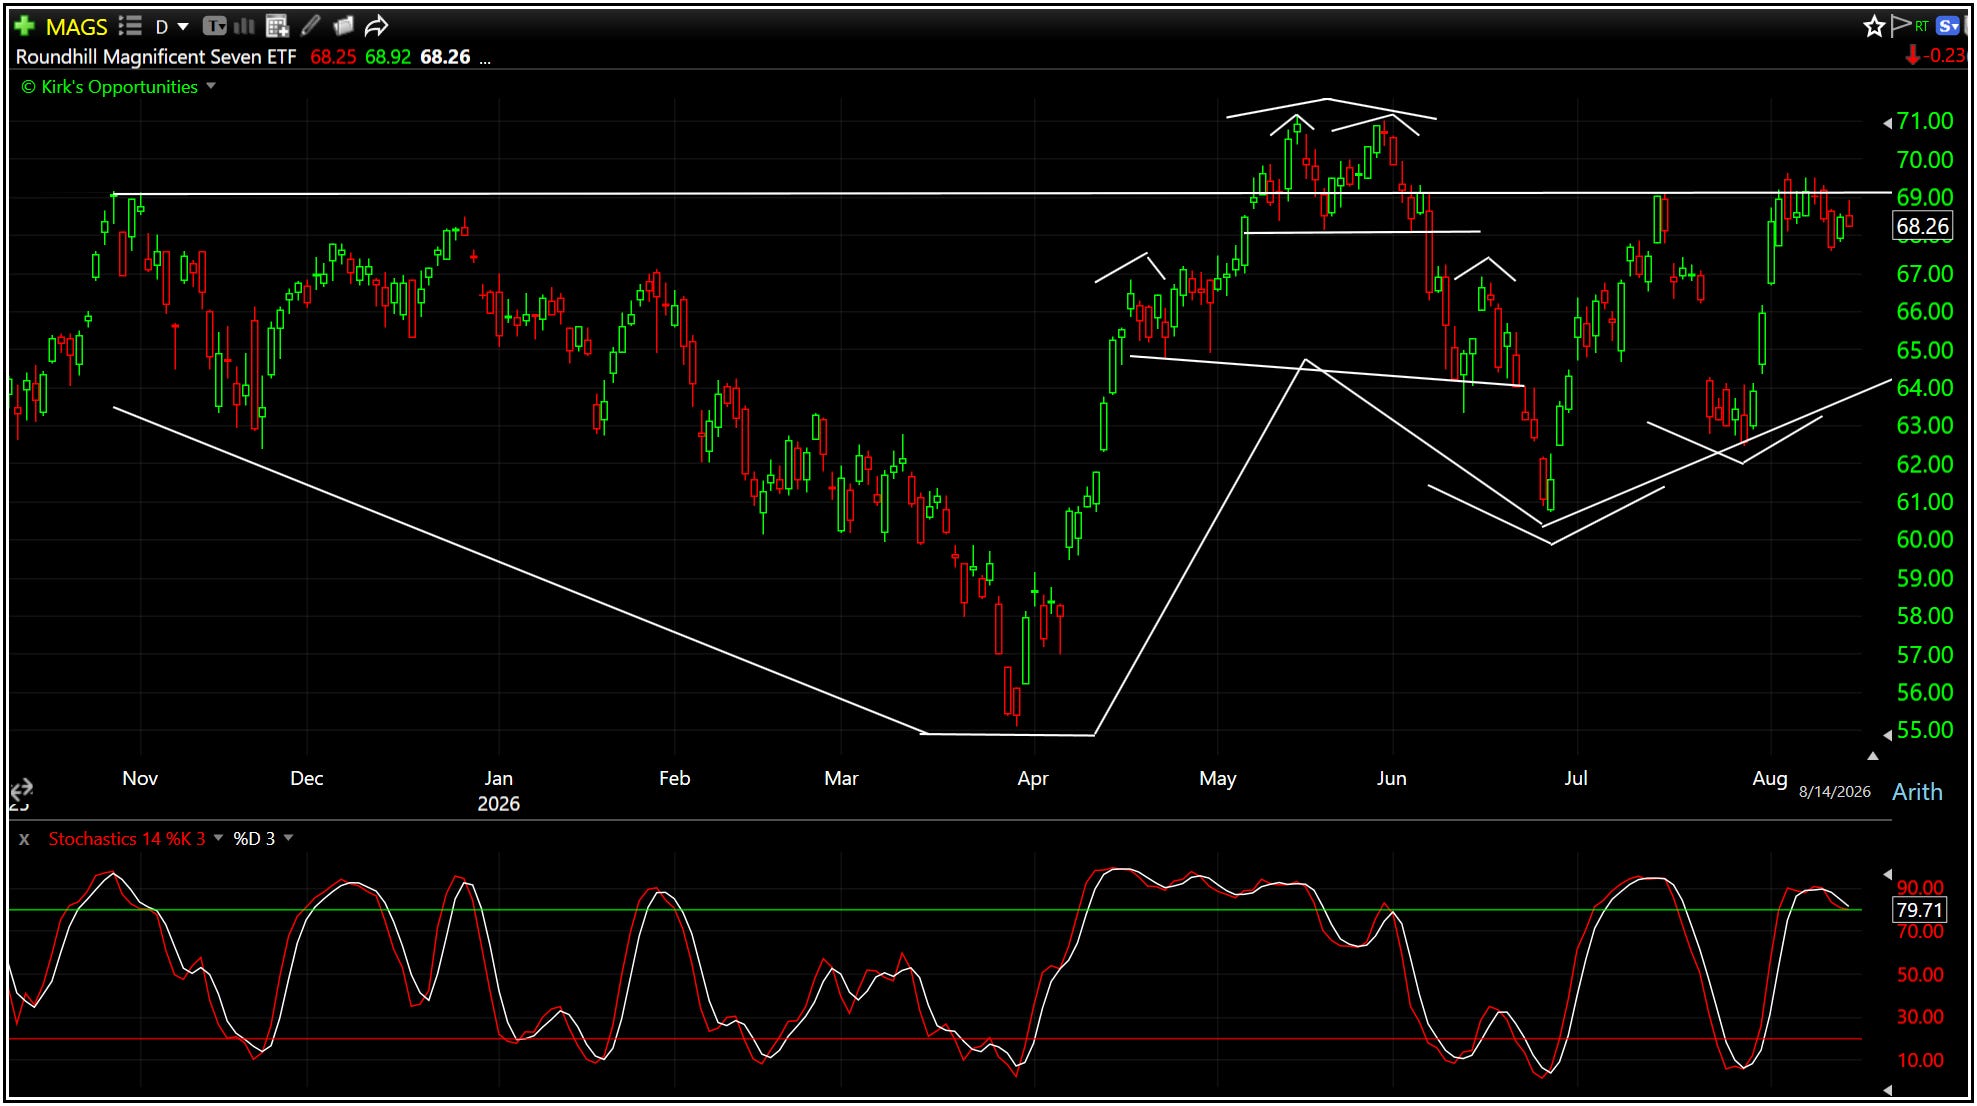
The Magnificent 7 (MAGS) is still working on recovering from this summer’s bull-trap reversal, extending its broader consolidation to more than nine months.
A strong and sustained move above this year’s $71 high would be a significant development, increasing the probability of seeing S&P 8000 sooner rather than later.
The potential cup-and-handle structure targets approximately $83, which is more than +20% above last week’s close.
Nine months of consolidation can build a lot of fuel.
But only a breakout gets to light the match.
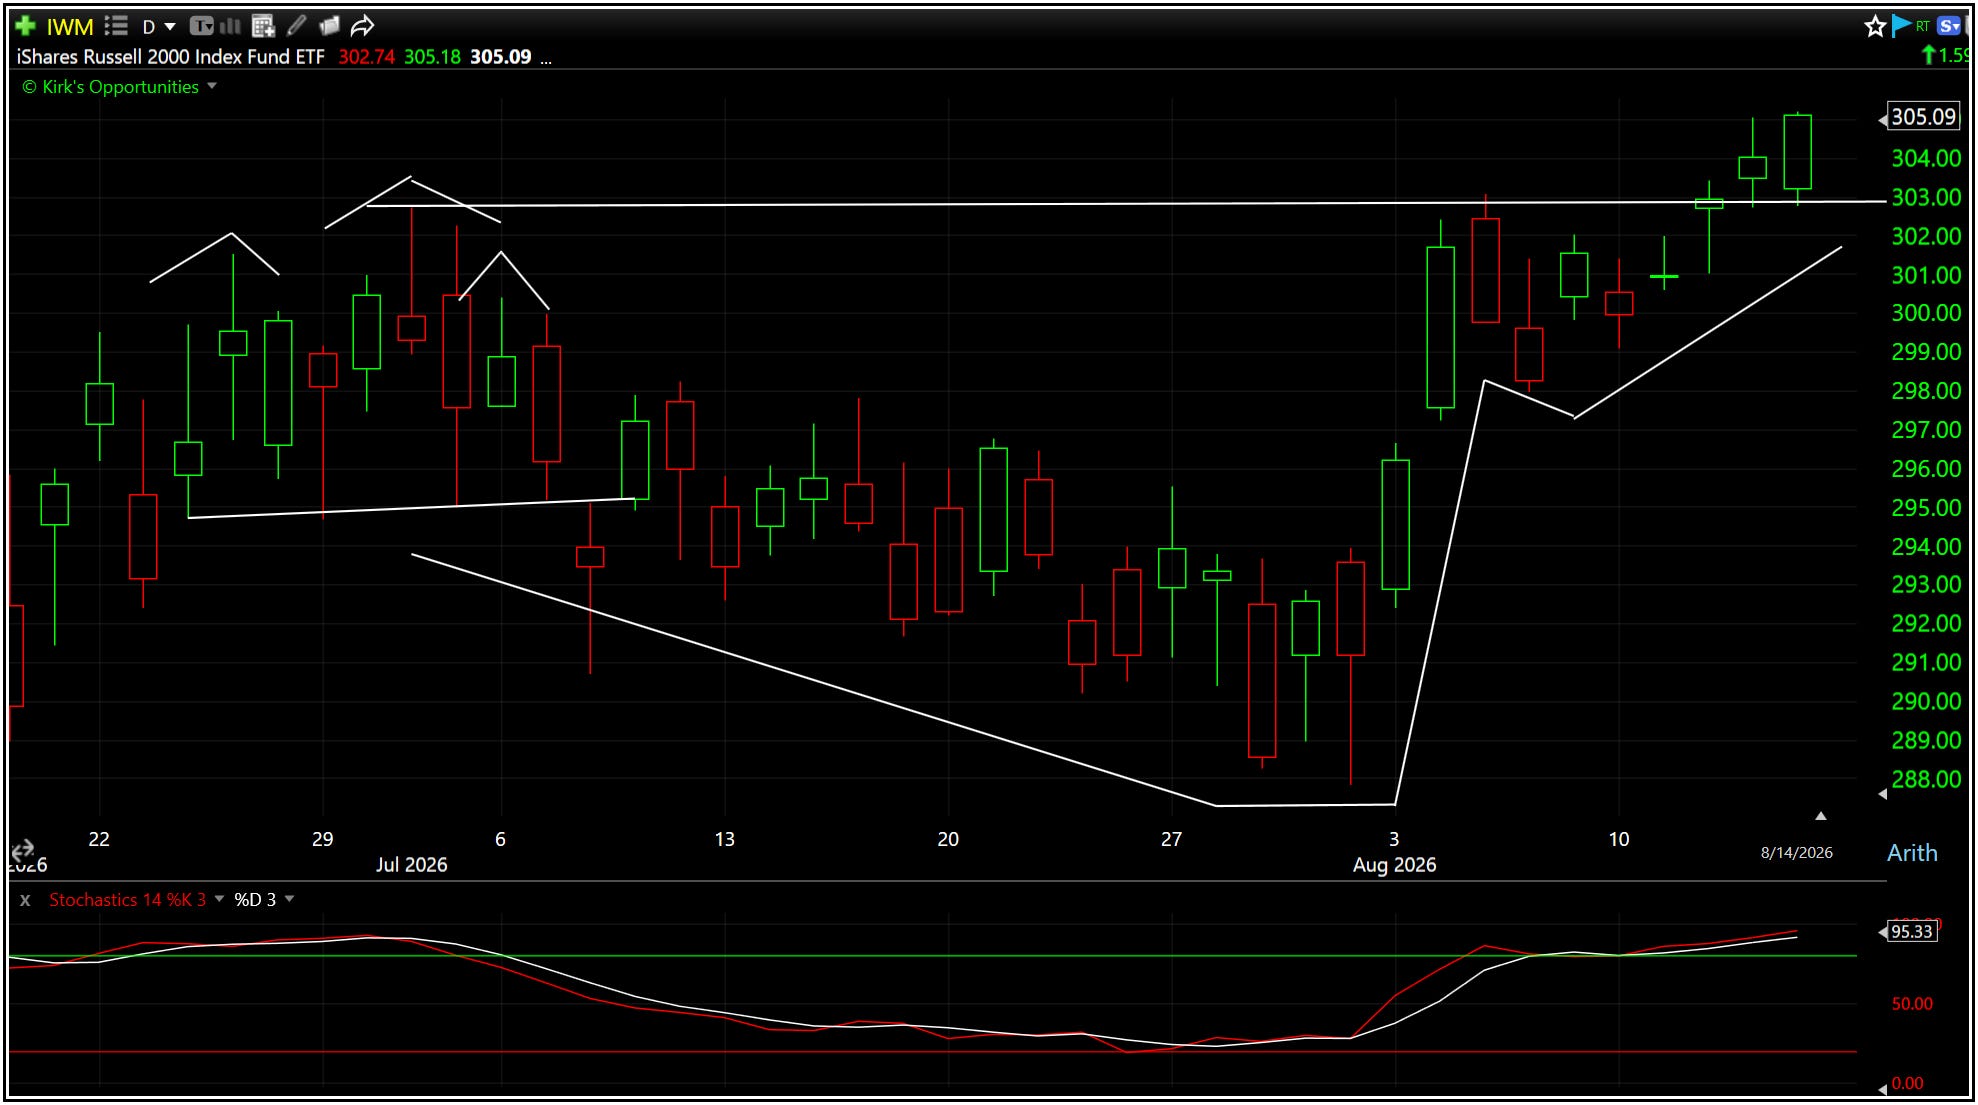
The Russell 2000 (IWM) reached another new high last week, breaking above its short-term cup-and-handle and putting the $317 target into play.
Now comes the part that matters:
Can it stay broken out?
Strong and sustained follow through would reinforce one of the healthier developments underneath this market.
A move back below approximately $302 would raise the possibility that the latest breakout is turning into another bull trap.
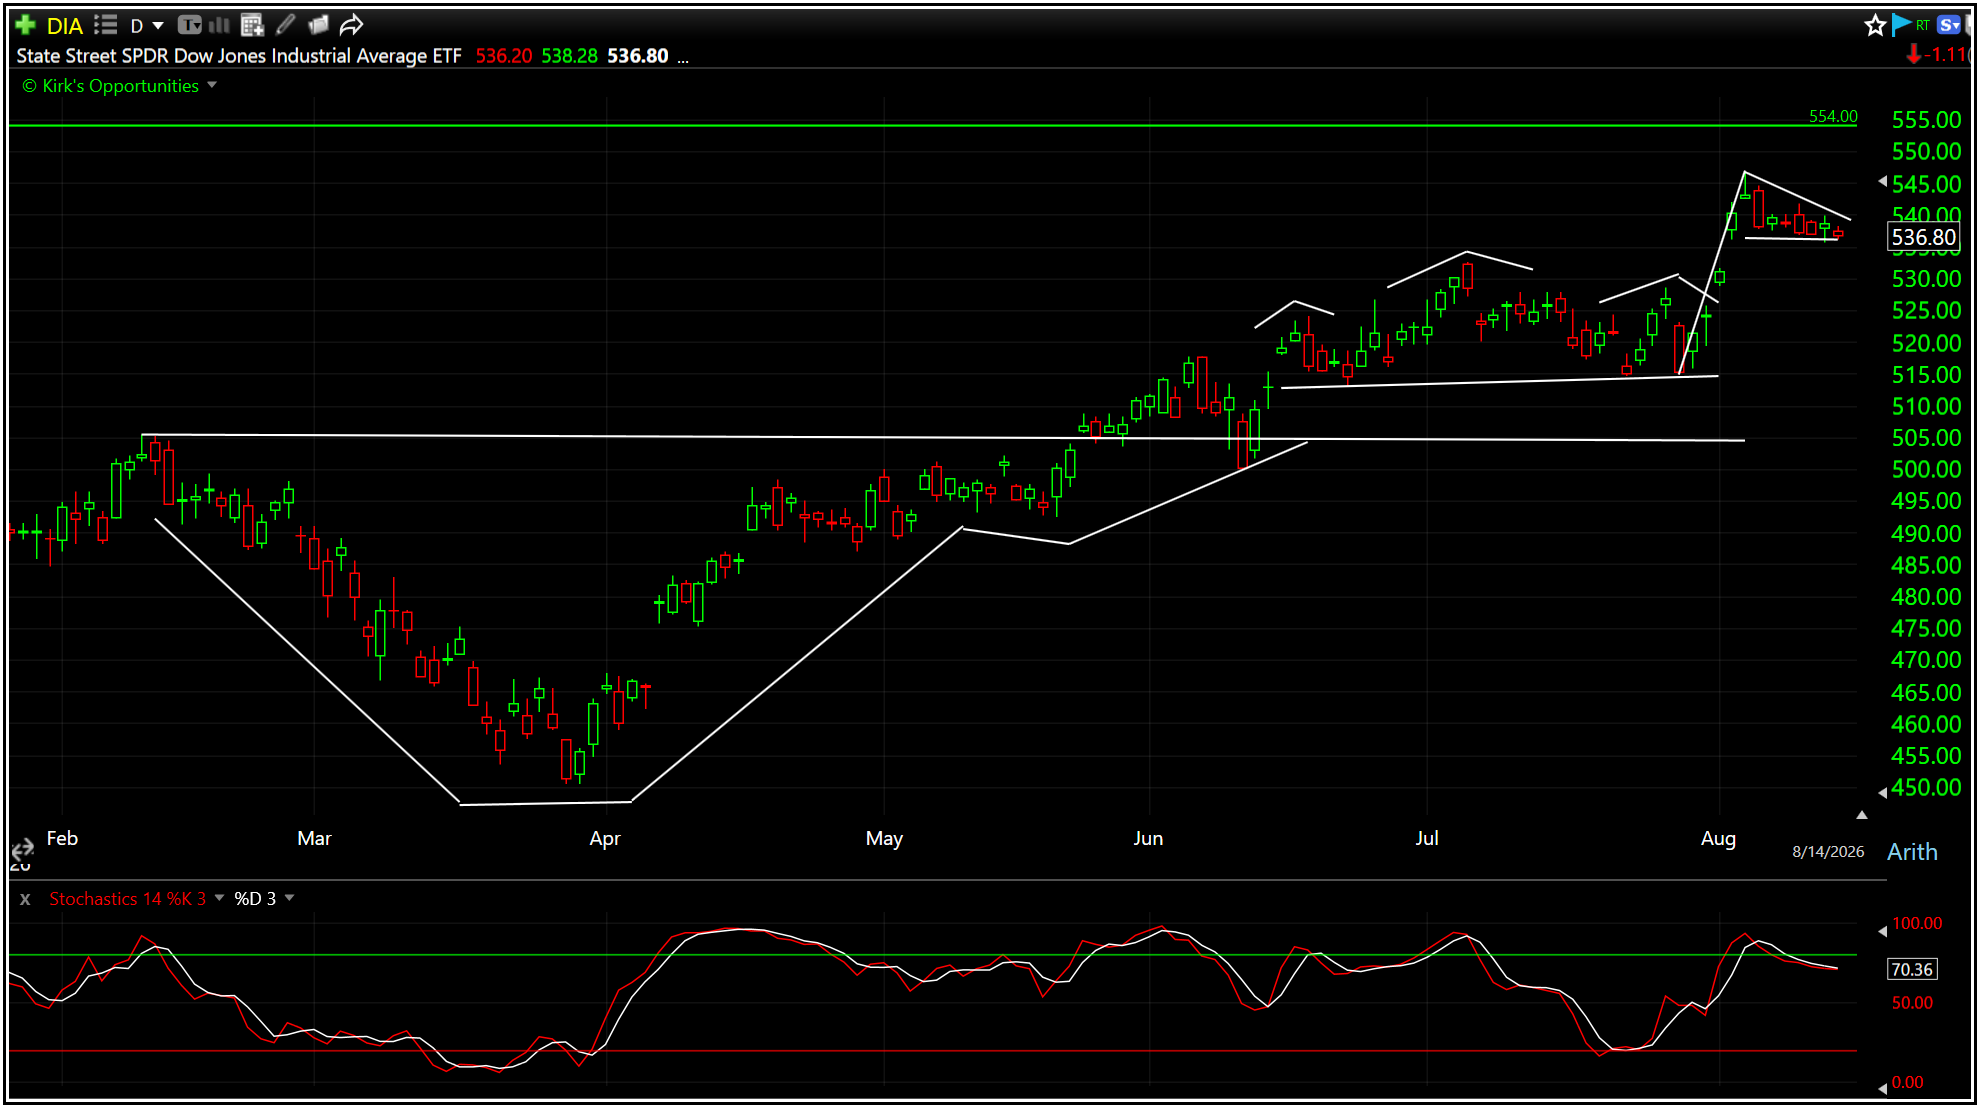
The Dow (DIA) was the only major index to finish lower for the week.
After holding its ground, refusing to roll back over and ultimately pushing to new highs, price is now flagging just below this year’s cup-and-handle target at $554.
Given the sustained upside follow through, this still appears to be a likely target capture, with this month’s $546 high the final hurdle to clear.
Beyond the major indexes, some of this summer’s fallen leaders are trying to get back their mojo.
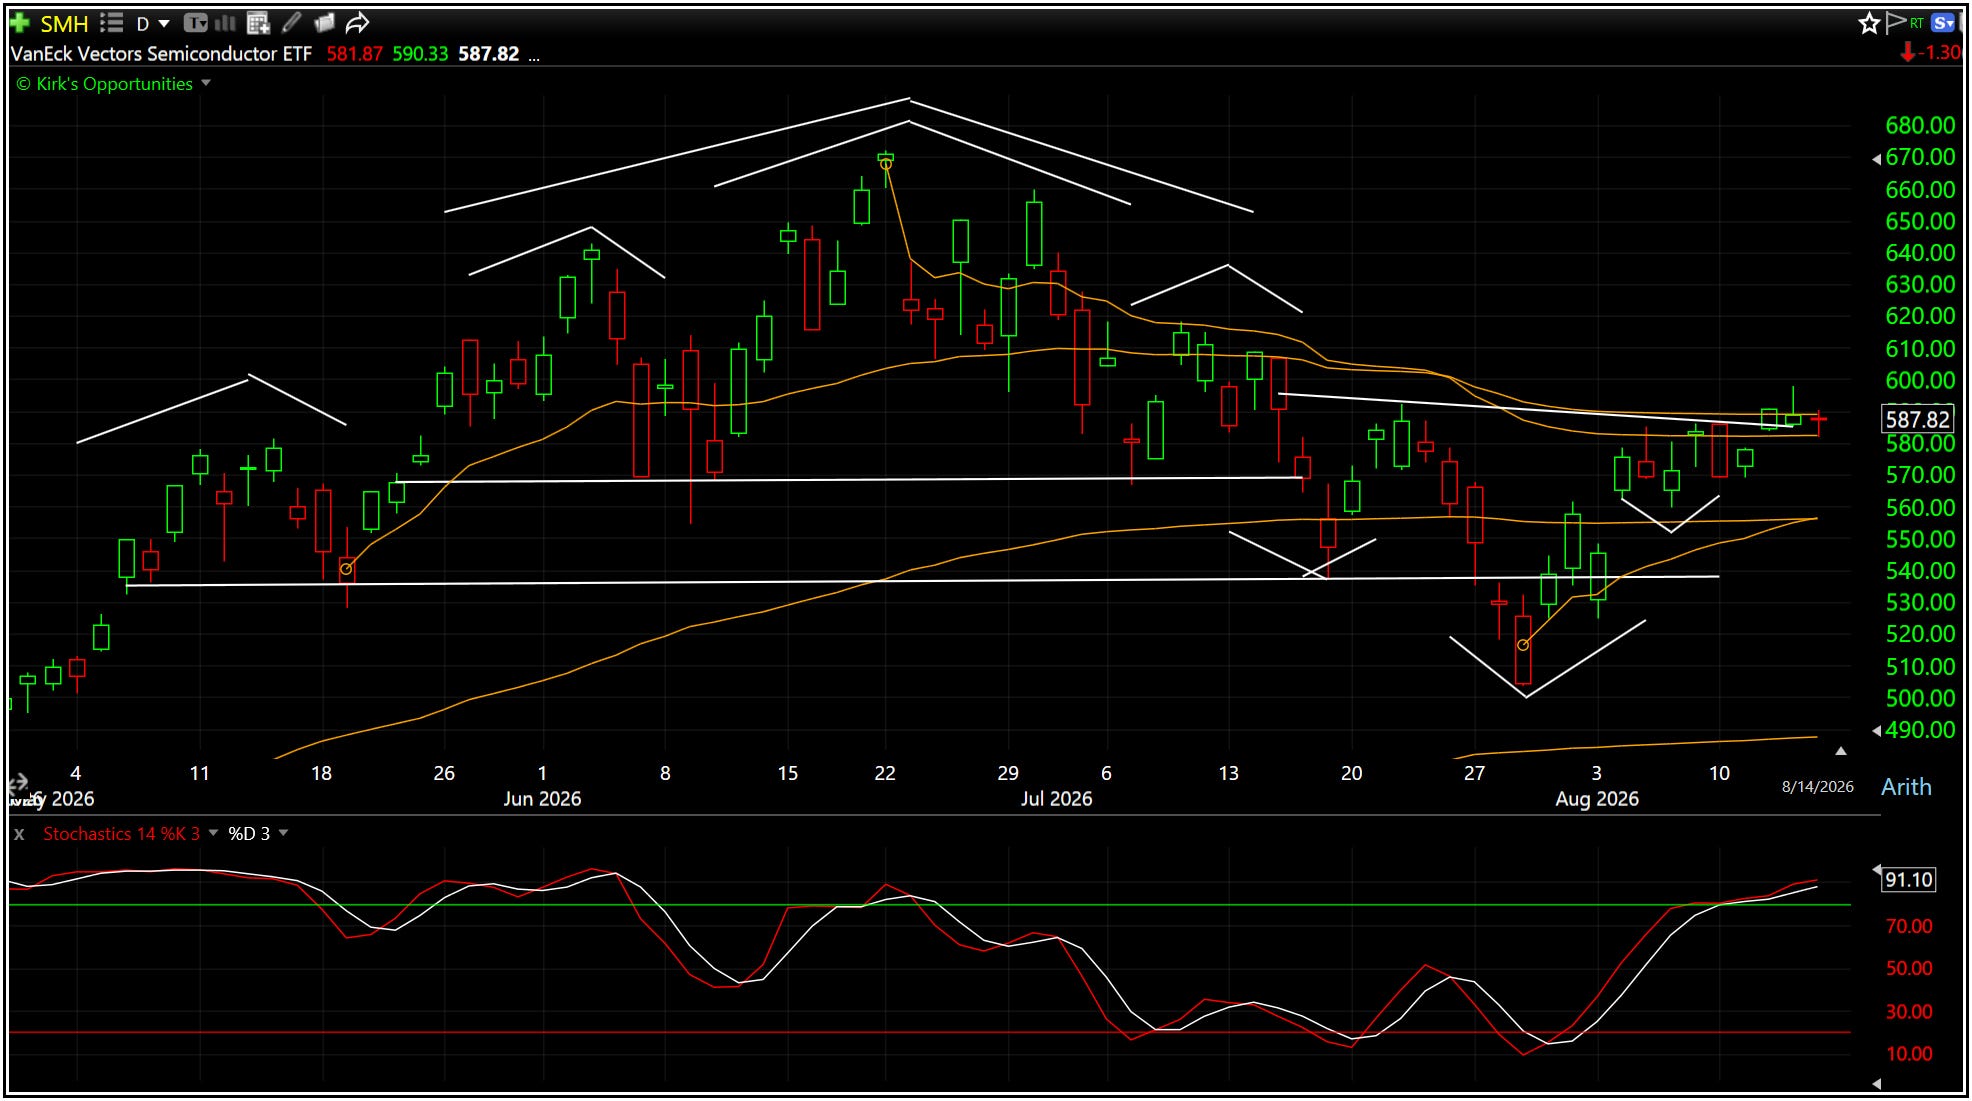
The Semiconductors (SMH) are working through a bear-trap reversal, but they still need stronger and more sustained follow through.
Otherwise, the recent rebound could simply become the right shoulder of another rollover.
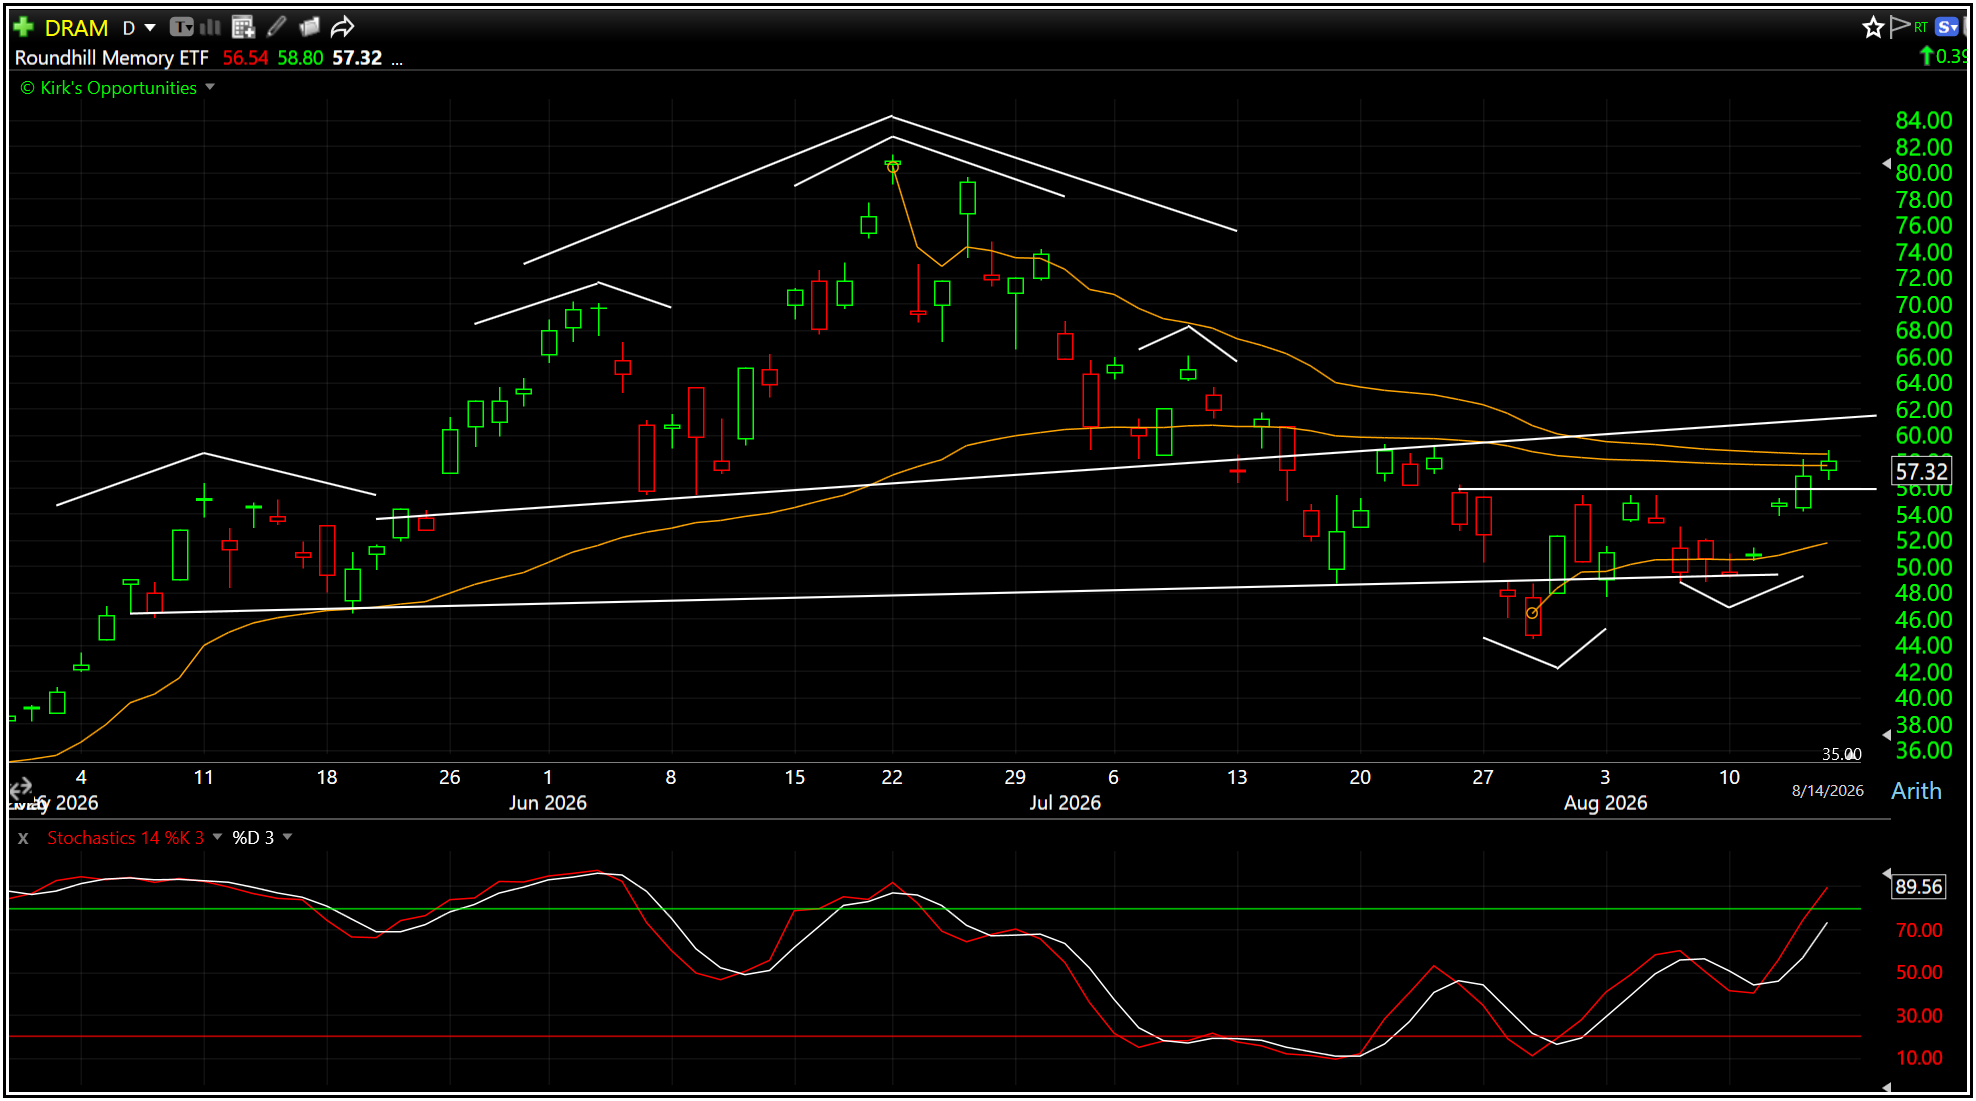
We can see a similar bear-trap reversal developing among the Memory/DRAM stocks.
Here too, we want to see higher highs and continued follow through rather than another lower right-shoulder reversal.
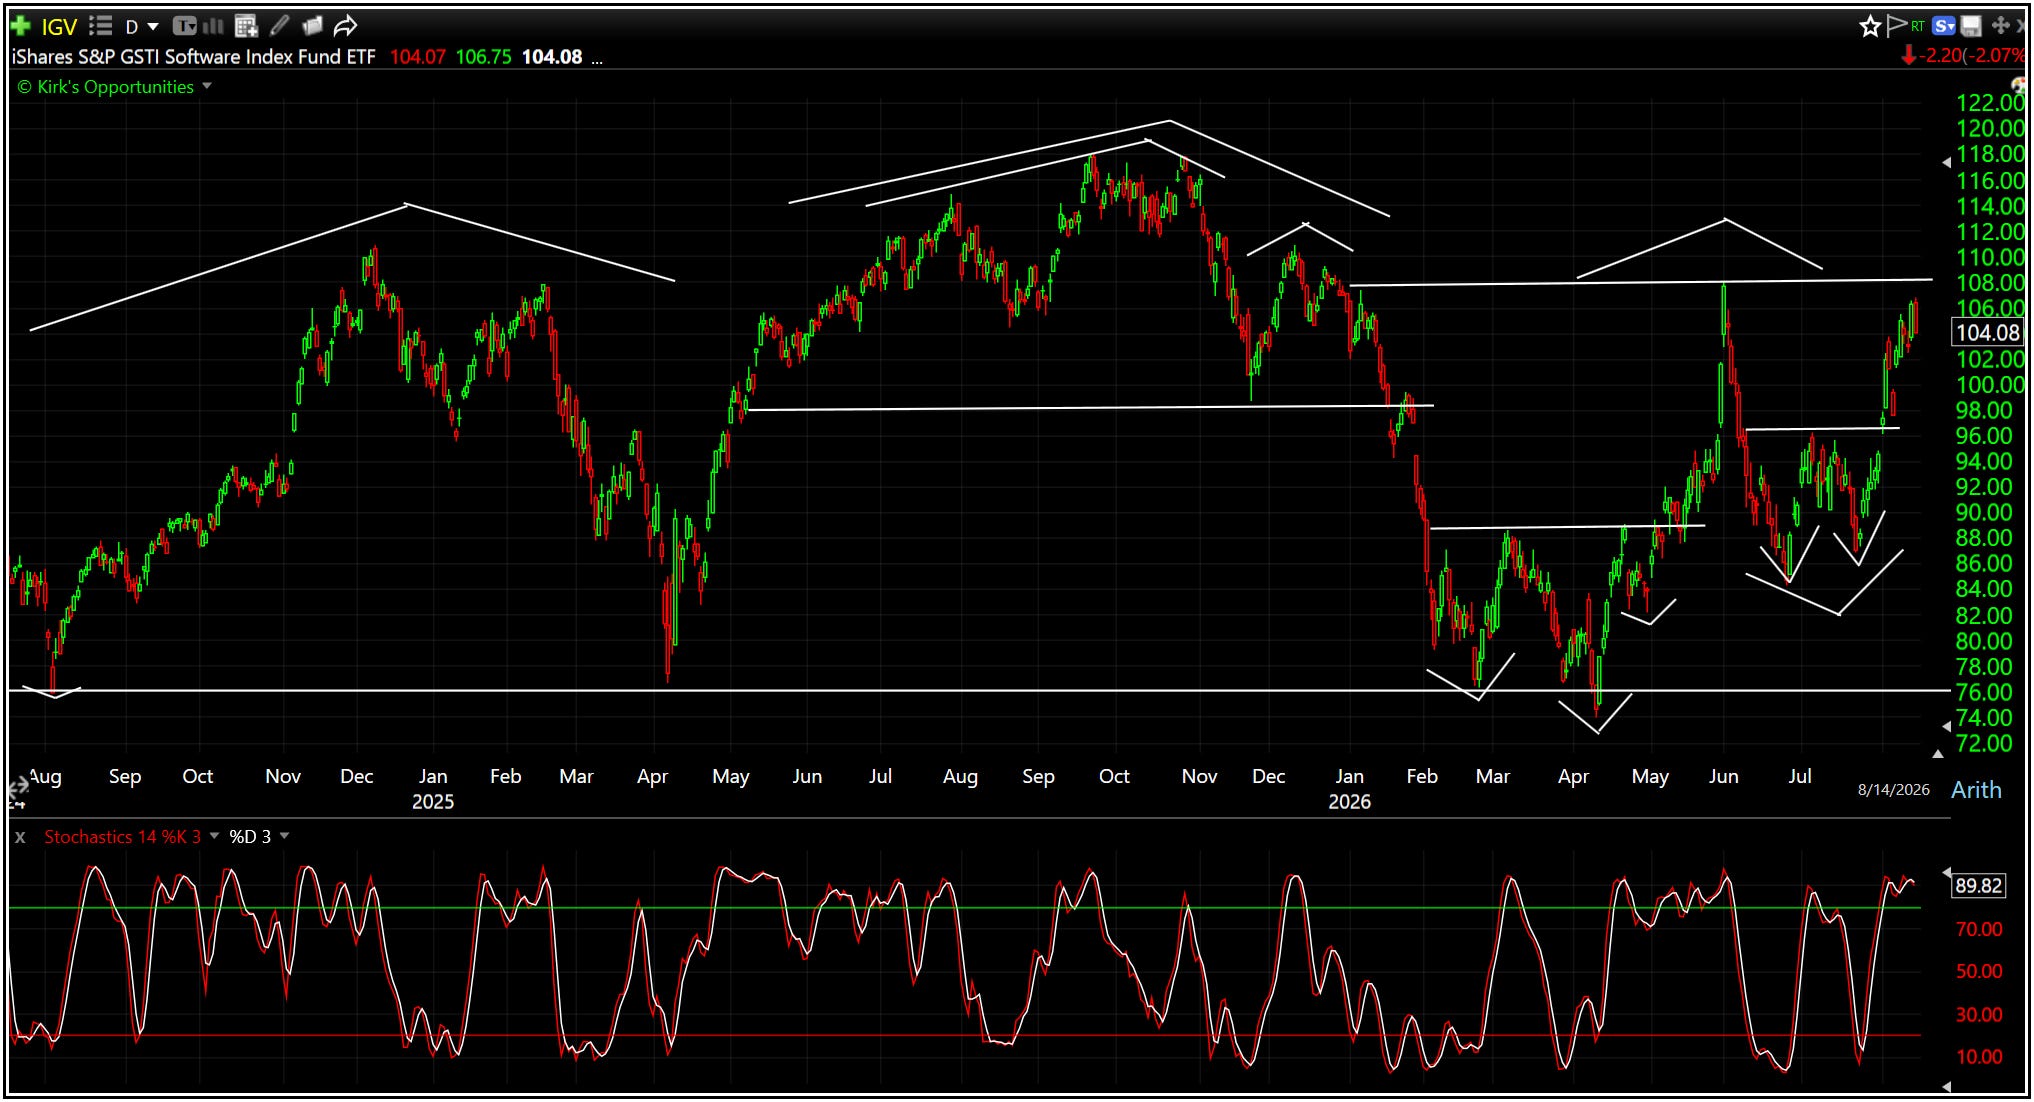
Software (IGV) continues to experience volatility within its multi-year range. Numerous reversal attempts are working, but none has yet been strong enough to finally break the group free.
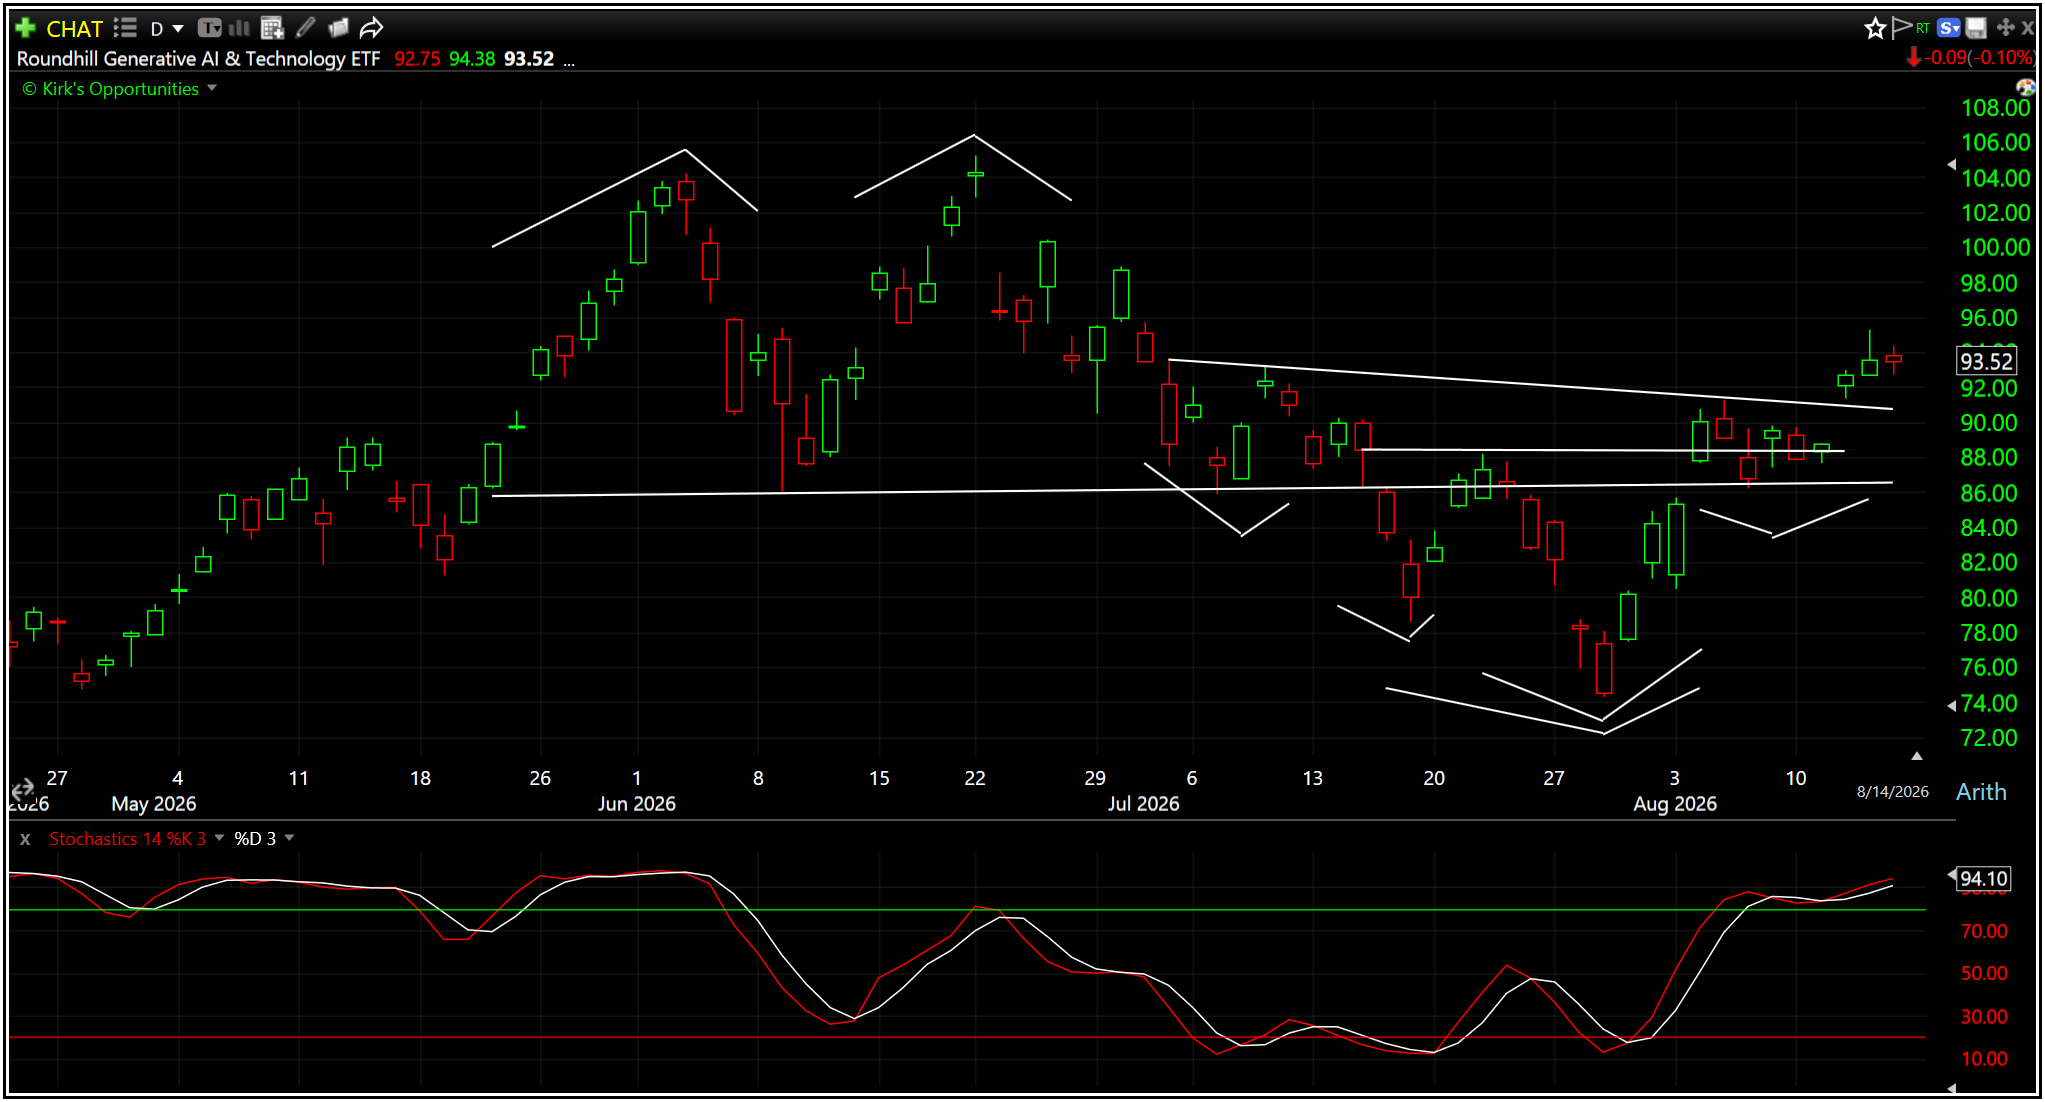
AI & Technology (CHAT) is rebounding from its recent correction with another bear-trap reversal in motion targeting a new high.
Same test.
Follow through or failure.
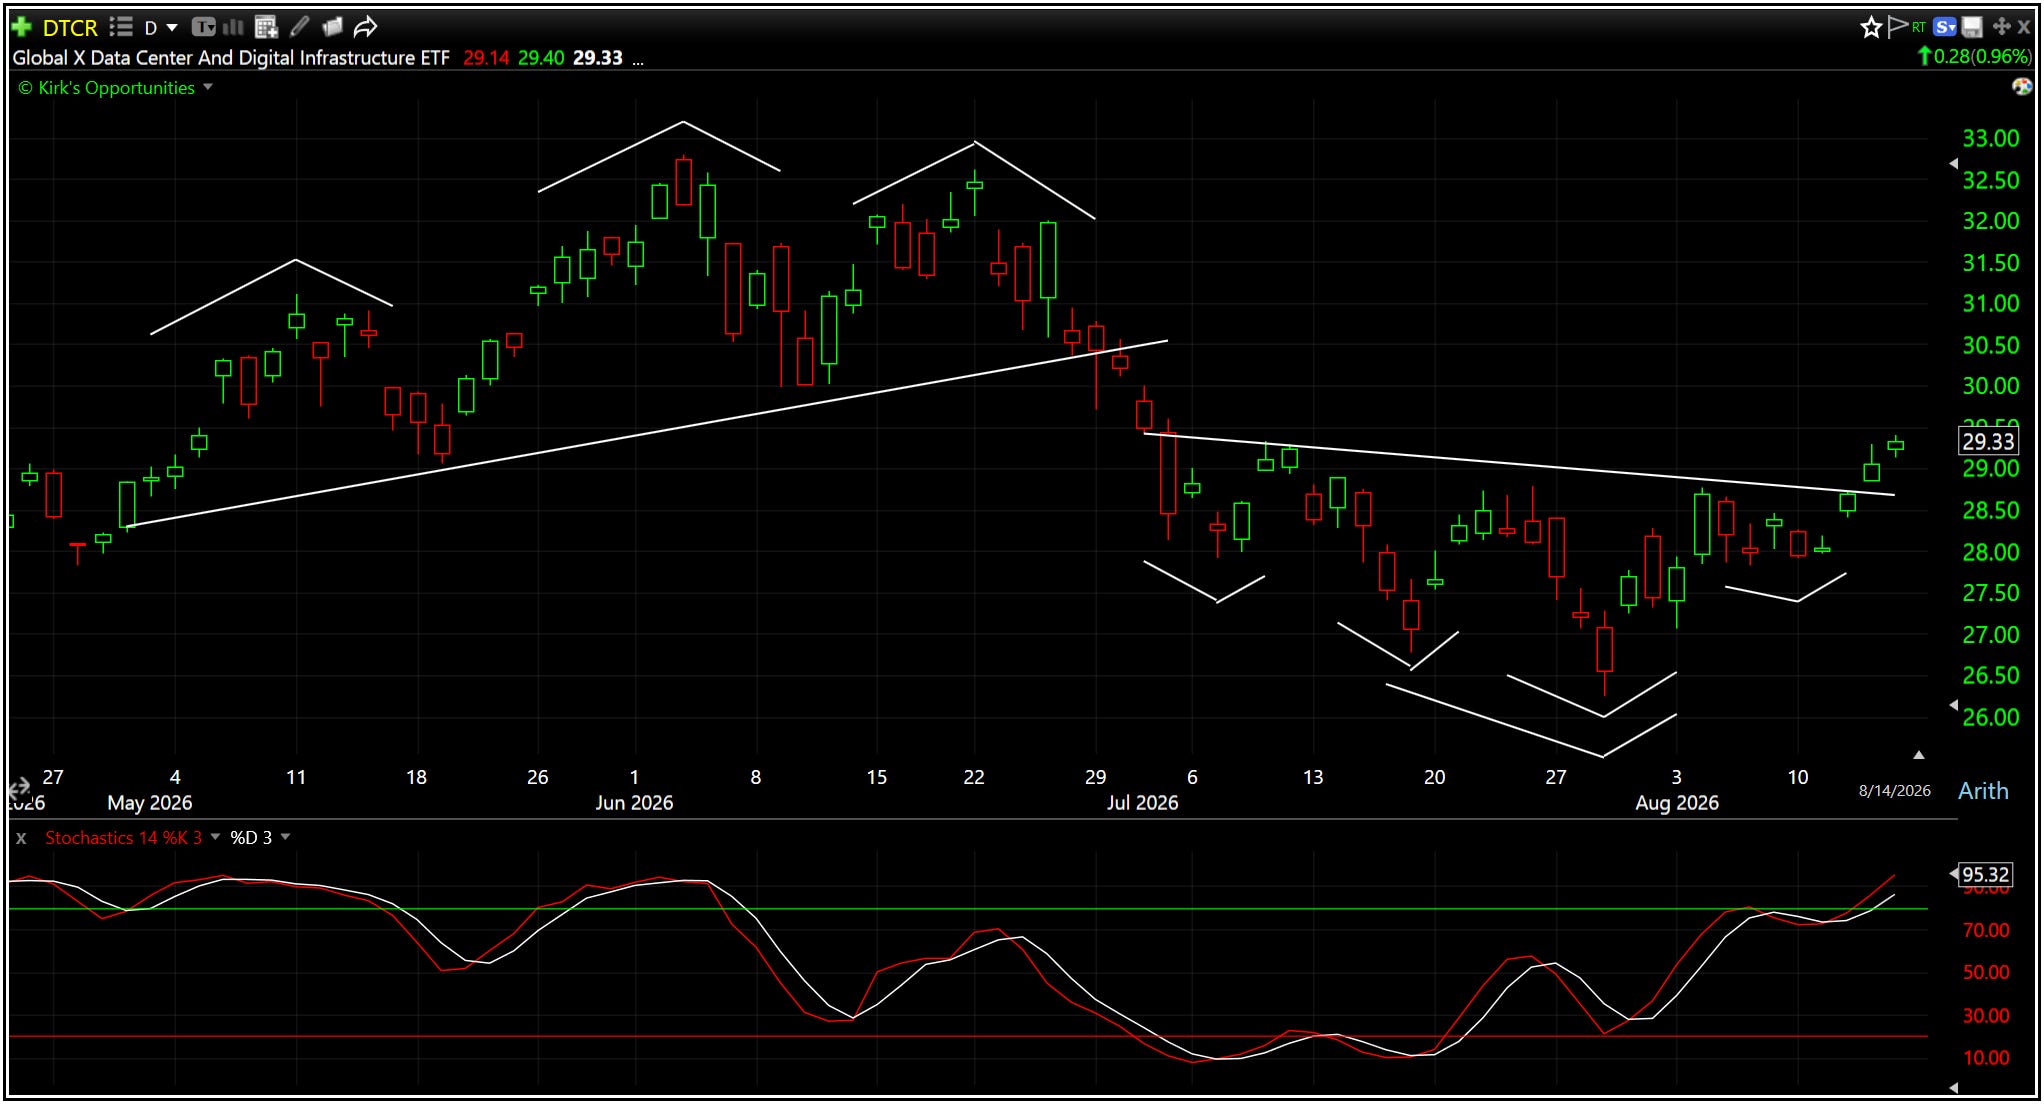
Data Center & Digital Infrastructure (DTCR) has a reversal play developing as well.
With last week’s matrix, these were the top 10 winners and losers:
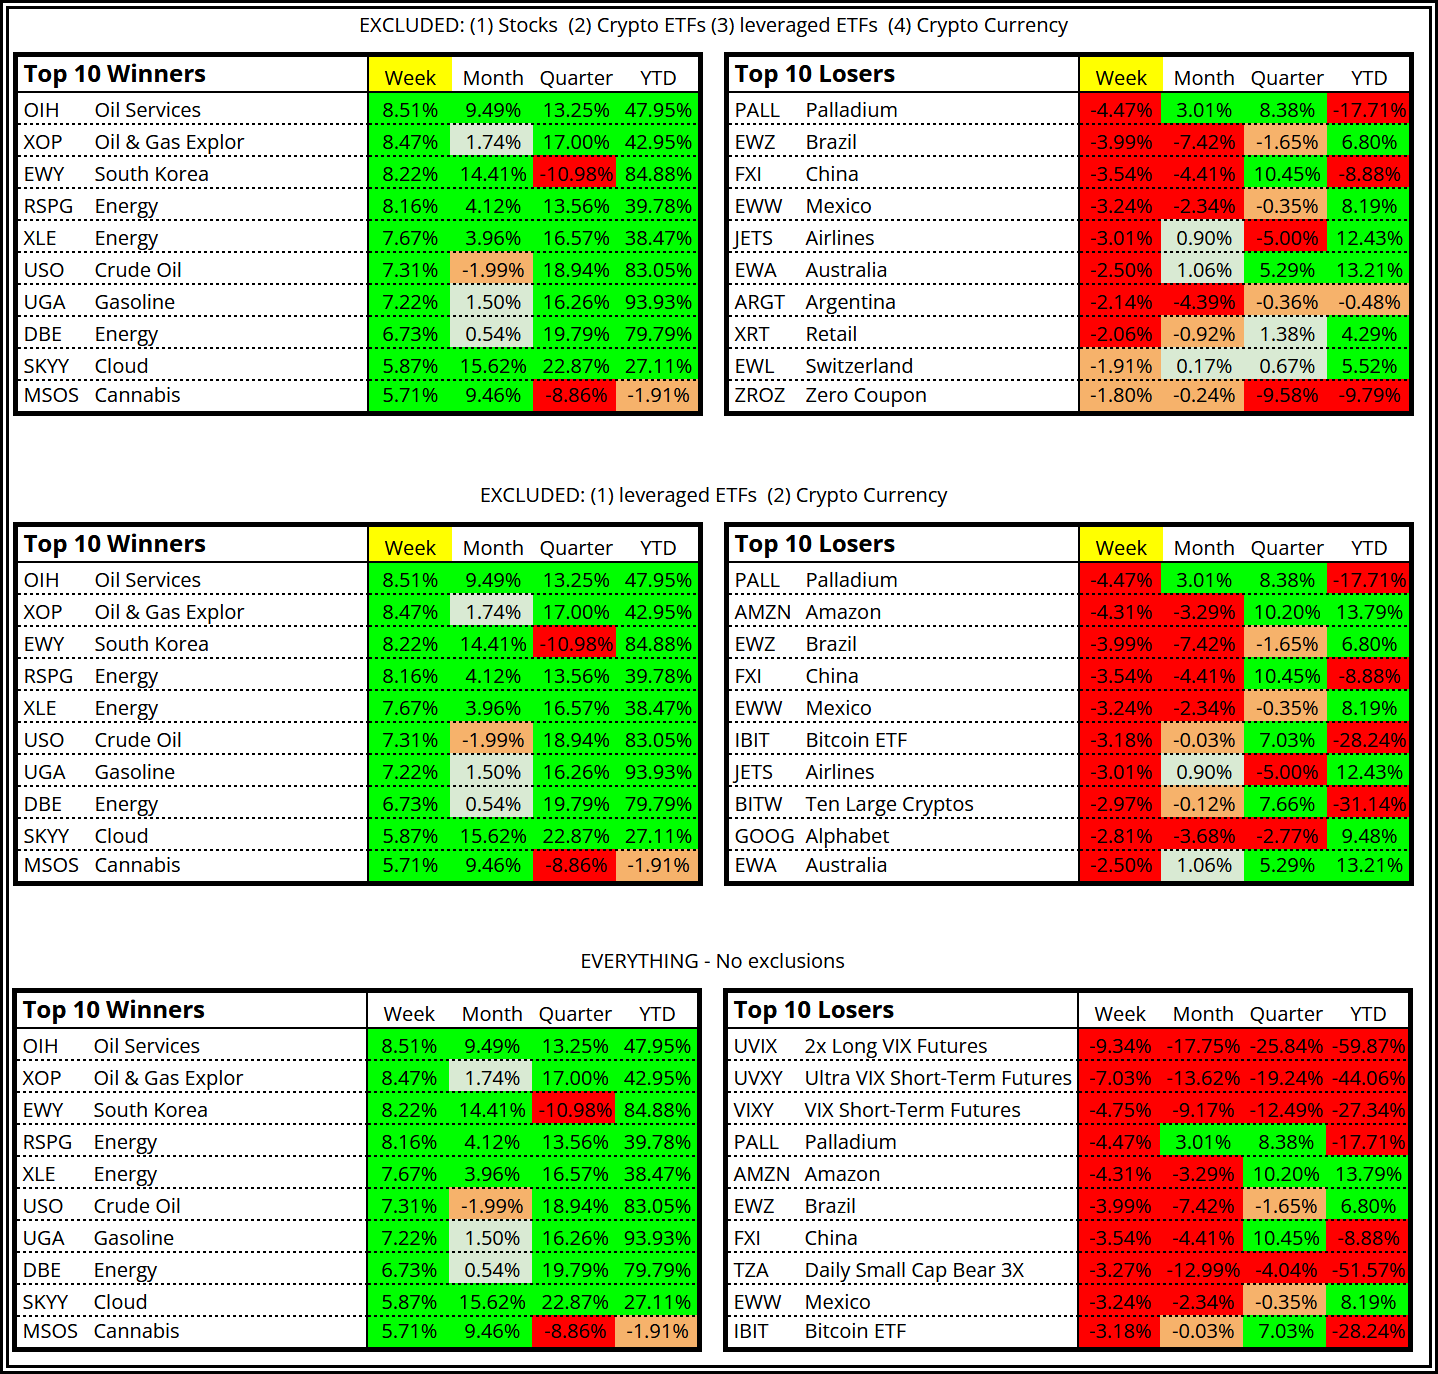
A few things jump off the page.
Energy is impossible to miss.
But look beyond the biggest winners and there is an even more important story developing underneath the market:
Leadership is broadening. Risk appetite is expanding. And the market is becoming less dependent on the Magnificent 7.
The rest of this week’s report goes beyond what happened and focuses on what to do next.
We’ll break down where leadership is broadening, which areas are becoming more attractive, what this week’s catalysts could change, the key price levels to watch, and the Bull, Base and Bear scenarios for the week ahead.
The objective isn’t simply to know what happened. It’s to know what to do next.
Upgrade to continue reading the full report.
