


The S&P 500 is sitting just below a record high.
Roughly 40% of stocks are already more than 20% below their own highs.
Hard to believe, but both things are true.
That is the market we have right now: strong indexes sitting on top of a correction that has already done considerable damage underneath. Technology and mega-cap growth are holding the surface together while small caps, financials, real estate and other rate-sensitive areas absorb the punishment.
The question is no longer whether breadth is weak. We know it is.
The question now is whether the damage begins to repair — or finally reaches the stocks holding the indexes together.
Major Indexes
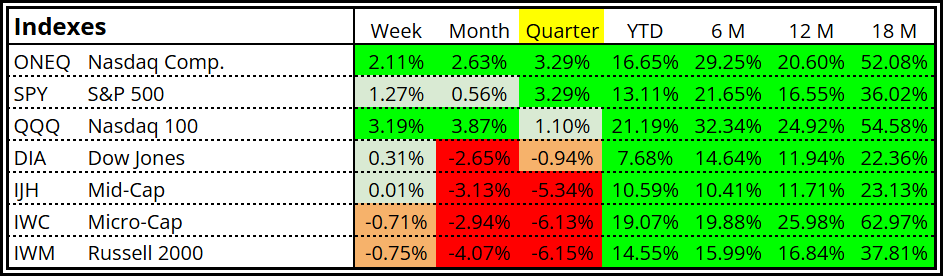
The headline indexes still look strong, but the table below shows how dramatically performance changes as we move down the market-cap spectrum.
The Nasdaq Composite gained +2.11% for the week and the Nasdaq 100 rose +3.19%, while the S&P 500 added +1.27%. But mid-caps were essentially flat at +0.01%, micro-caps fell -0.71%, and the Russell 2000 declined -0.75%.
The divergence becomes even more striking when we widen the lens. For the quarter, the S&P 500 and Nasdaq Composite are both up +3.29%, while mid-caps are down -5.34%, micro-caps -6.13%, and the Russell 2000 -6.15%.
That is the hidden correction in one table: the larger the company, the better the market has treated it.
S&P 500 Sectors
The sector picture tells the same story.
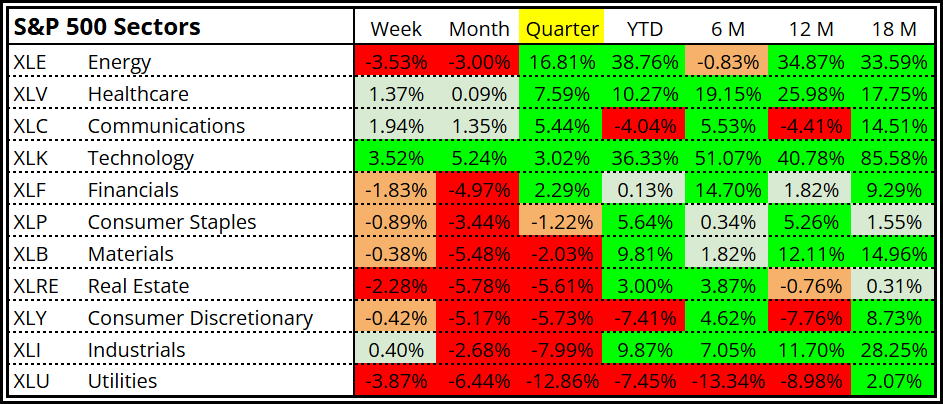
Technology gained +3.52% for the week and is now up +5.24% for the month, while Communication Services and Health Care also finished higher. At the other end, Utilities fell -3.87%, Energy -3.53%, Real Estate -2.28%, and Financials -1.83%.
Again, the longer view matters. Technology remains up +36.33% year to date, while Utilities are down -7.45%, Consumer Discretionary -7.41%, and Communication Services -4.04%.
The index-level strength is real, but it is being carried by a relatively small group of leaders.
Industry Groups: Where the Repair Is Starting
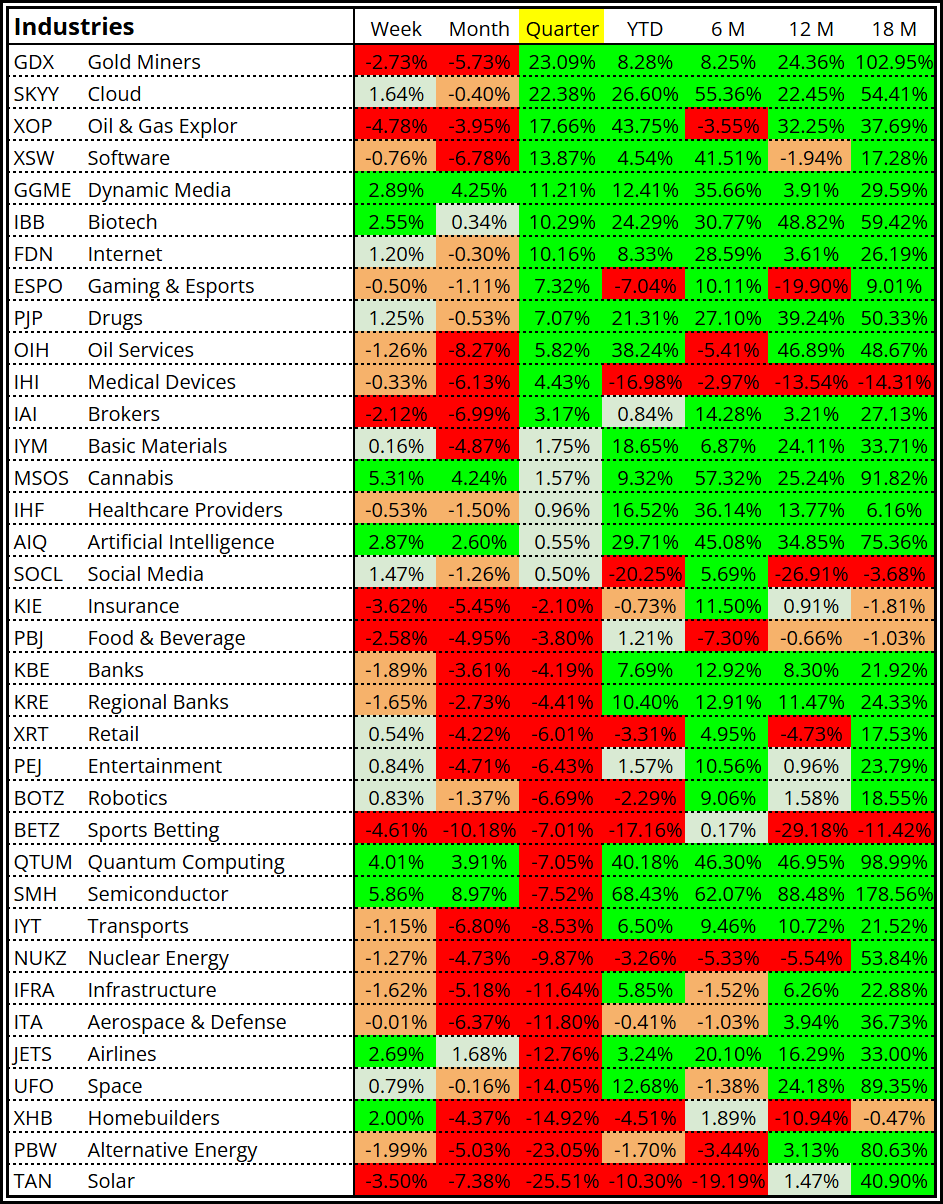
The industry-level picture gives us a better look at what may be changing beneath the surface.
Leadership is still clear. Semiconductors gained +5.86% for the week, while Quantum Computing rose +4.01%, Artificial Intelligence +2.87%, and Dynamic Media +2.89%.
But the more interesting development may be the early improvement in groups that have already absorbed substantial damage. Biotech gained +2.55%, Airlines +2.69%, and Homebuilders +2.00% for the week. Yet Airlines remain down -12.76% for the quarter, Homebuilders -14.92%, and Semiconductors -7.52%.
That is exactly what we want to watch now: not simply what is leading, but whether buyers are beginning to return to areas that have already corrected.
At the same time, Banks, Regional Banks, Insurance, Transports, Infrastructure and several other rate-sensitive groups remain weak.
So far, this looks like selective repair — not broad repair.
Large-Cap Growth Is Still Carrying the Load
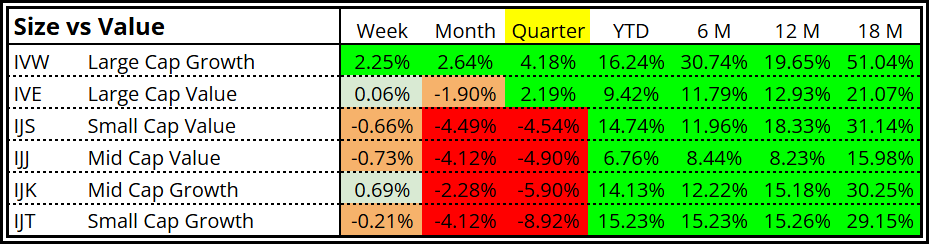
The size and style breakdown makes the concentration even clearer.
Large Cap Growth gained +2.25% for the week, +2.64% for the month, and +4.18% for the quarter. No other size/style segment has remained positive across all three periods.
Large Cap Value is still up +2.19% for the quarter, but its recent momentum has weakened. Below large caps, the damage is much more obvious: Mid Cap Value is down -4.90% for the quarter, Mid Cap Growth -5.90%, Small Cap Value -4.54%, and Small Cap Growth -8.92%.
The market has not simply favored growth over value. It has increasingly favored size — and especially large-cap growth.
The Magnificent 7 Are Rotating Too
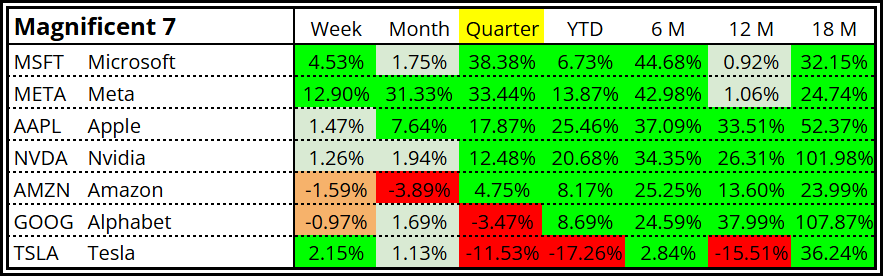
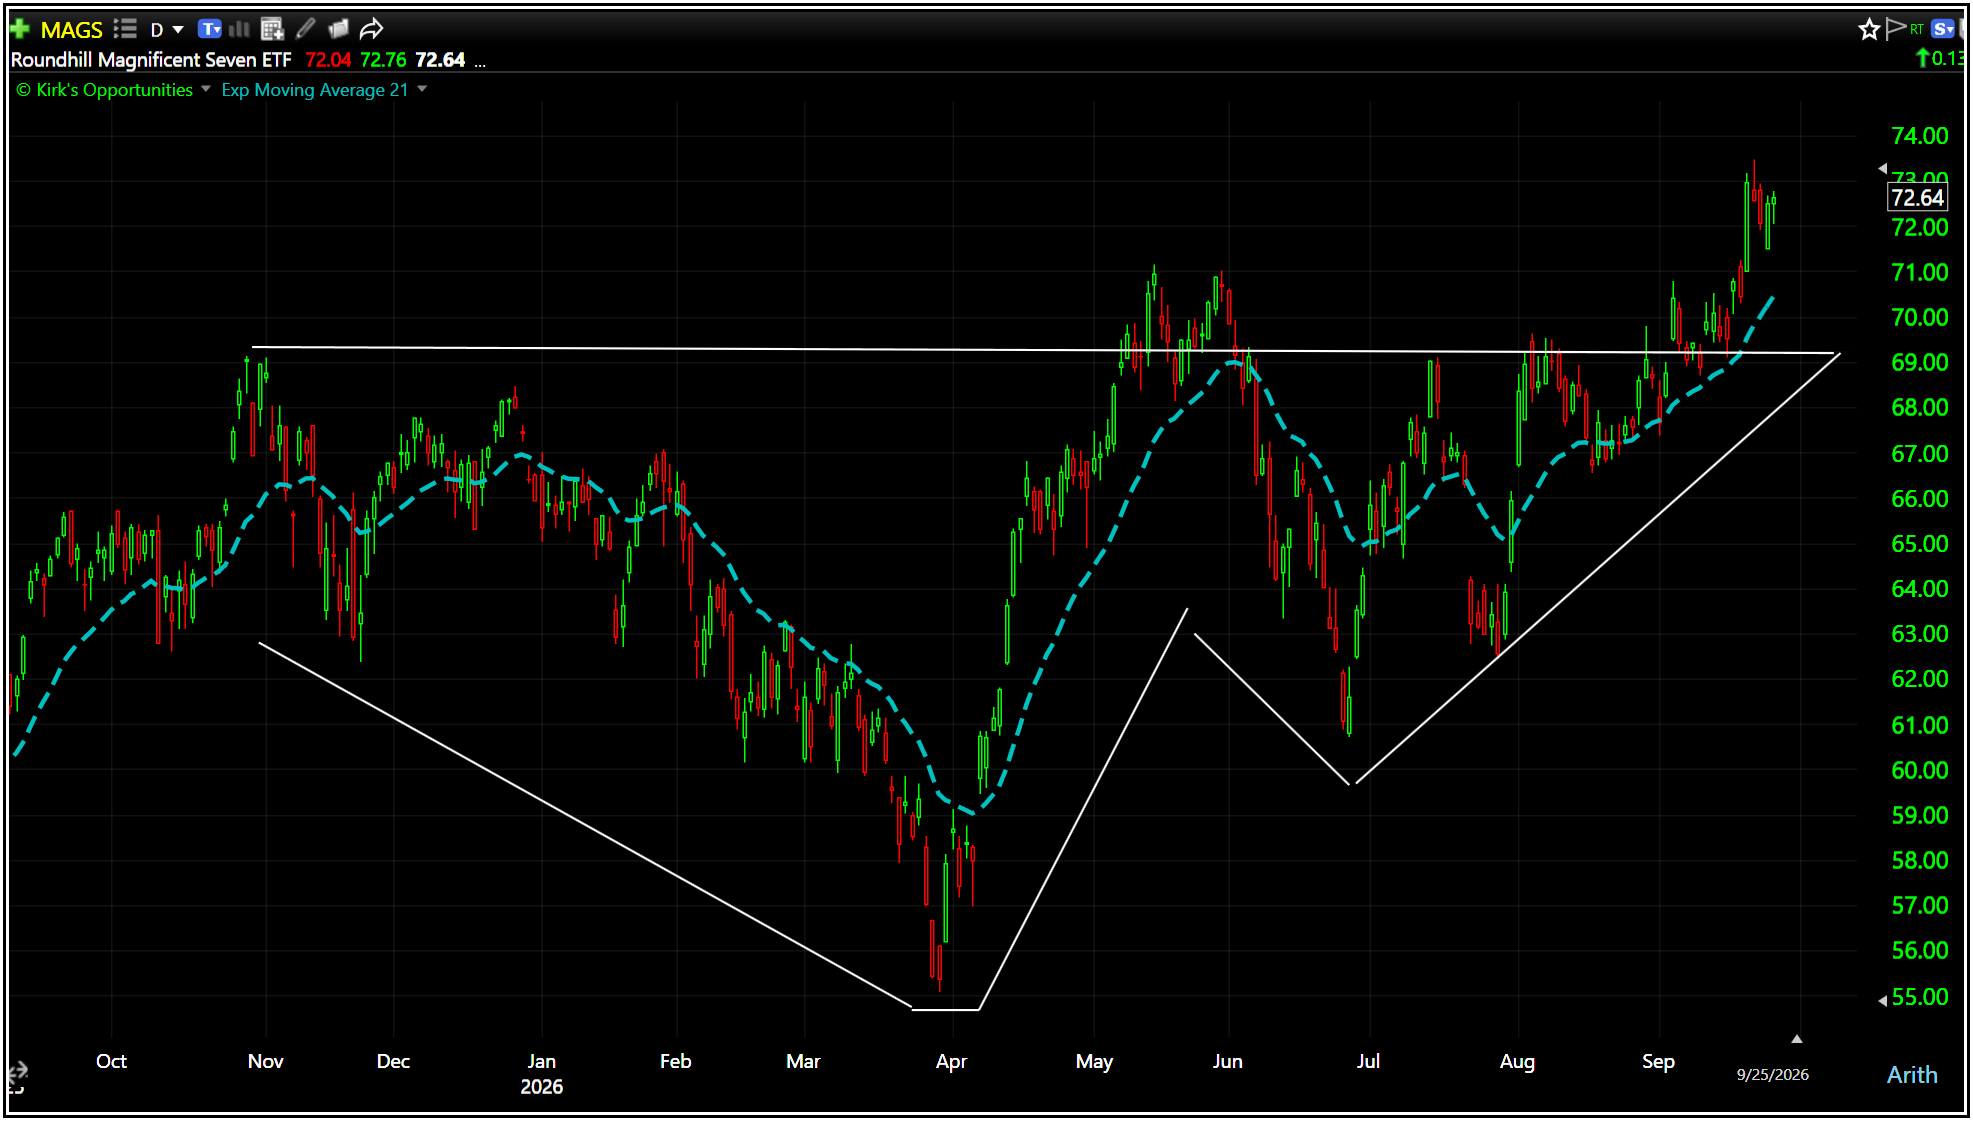
Large-cap growth is carrying much of the market, but even within the Magnificent 7 the strength is highly uneven.
META gained +12.90% for the week and is now up +33.44% for the quarter, while Microsoft advanced +4.53% for the week and remains the strongest Magnificent 7 stock for the quarter at +38.38%. Apple and Nvidia also remain positive across the week, month and quarter.
But not every mega-cap leader is participating. Amazon fell -1.59% for the week, Alphabet declined -0.97%, and Tesla remains down -11.53% for the quarter and -17.26% year to date.
Even within the market’s strongest area, leadership remains concentrated rather than universal.
Semiconductors Still Own the Tape
Semiconductors were the clearest source of strength. AMD gained nearly +10% Monday, reached another all-time high, crossed $600 and pushed its market capitalization above $1 trillion. Intel also rallied sharply, while memory stocks continued attracting strong demand.
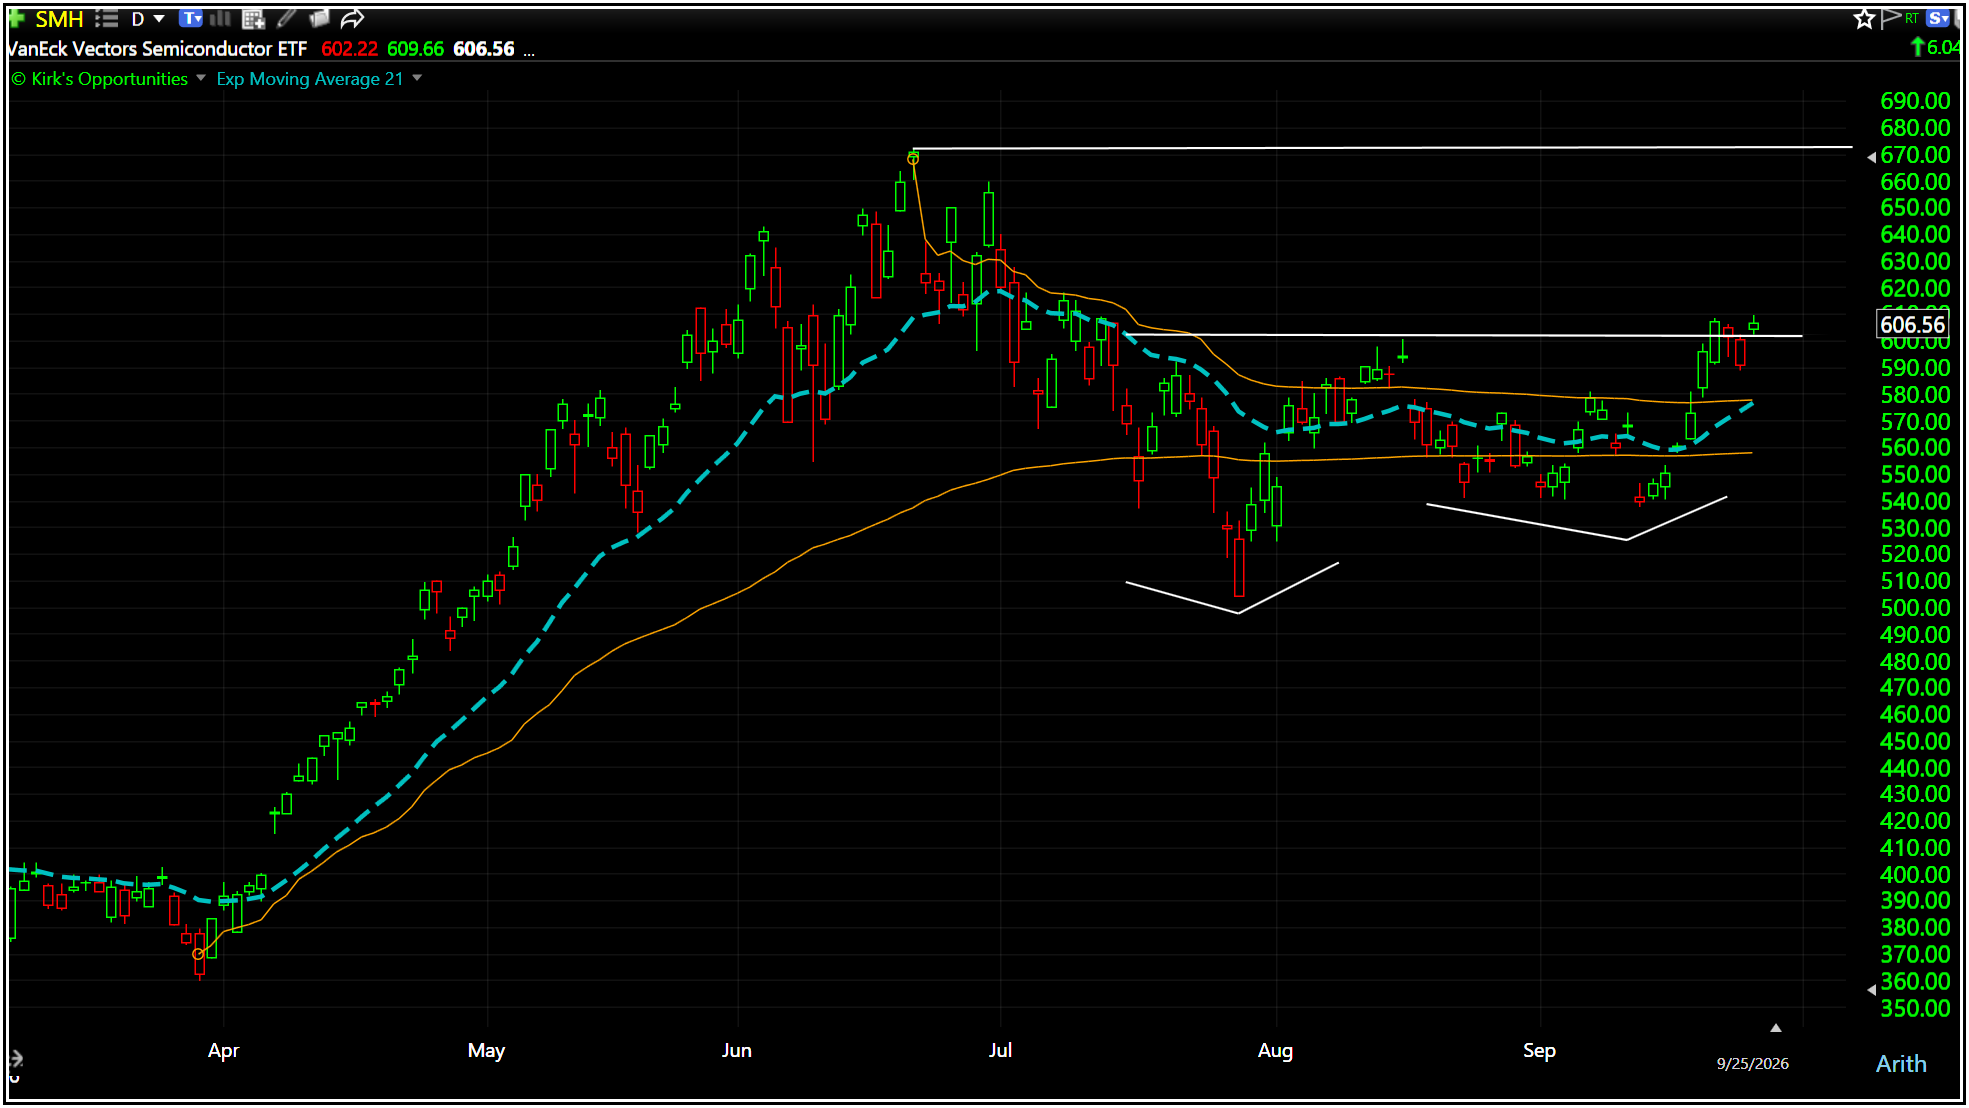
The broader message matters more than any individual stock. Investors continue rewarding the companies viewed as essential to AI development, and so far even Treasury yields above 5% have not broken that leadership.
Price continues telling us where demand is strongest.
Mega-cap growth was nearly as important. META surged as enthusiasm around Muse accelerated, giving investors another glimpse of the shift from AI infrastructure spending toward actual consumer products and monetization.
Muse also offered a preview of the next stage of disruption. Insurance, travel and other consumer-facing businesses came under pressure as investors considered what happens when AI agents make it easier to shop, compare, cancel and switch providers. Some companies may ultimately find it better to participate in these ecosystems than compete against them.
There is another reason AI leadership matters so much now: the investment boom is becoming increasingly important to S&P 500 earnings themselves. Goldman Sachs estimates that nearly half of this year’s S&P 500 EPS growth is tied directly or indirectly to AI investment. AI is no longer simply a technology story; it is increasingly part of the earnings engine supporting the index.
The broader earnings backdrop is unusually supportive as well. The S&P 500’s Q3 bottom-up EPS estimate has risen 1.3% since the beginning of the quarter, when analysts normally cut estimates by roughly 2%–3% over the same period. Estimated Q3 earnings growth now stands near 29%, up from 26.7% at the end of June.
Corporate guidance tells a similar story, but with an important concentration underneath. 72 companies have issued positive Q3 EPS guidance versus 44 negative, yet 61% of those positive guides came from Information Technology.
The semiconductor numbers make the concentration even clearer. Information Technology earnings are expected to grow roughly 64% in Q3, with semiconductor and semiconductor-equipment earnings up about 126%. Strip semiconductors out and expected technology-sector growth falls to roughly 24%.
The chip complex is not simply leading price. It is carrying an outsized share of earnings growth as well.
The longer-term handoff will be critical. Eventually, AI-driven productivity and monetization will need to replace AI-driven construction as the source of earnings growth. If spending slows before that handoff occurs, the effects could extend well beyond semiconductors.
There is also an important distinction as the AI boom matures: self-funded AI leaders are very different from debt-dependent AI infrastructure projects. Demand is not necessarily the questionable part. Execution is. Power, financing, construction, permitting and interconnections all have to line up before contracted demand becomes operating revenue and free cash flow.
And as agentic AI moves from answering questions to taking actions, another opportunity is emerging. Security, identity, permissions, monitoring and governance are becoming increasingly important parts of the AI stack. The more autonomy these systems gain, the greater the need to control what they can access and what actions they can take — reinforcing cybersecurity as another beneficiary of the AI buildout.
5% Rates Are Sorting Winners From Losers
Interest rates were the week’s other dominant force. The 10-year Treasury yield began the week below 5% and finished near 5.2%, reaching levels not seen in nearly two decades.
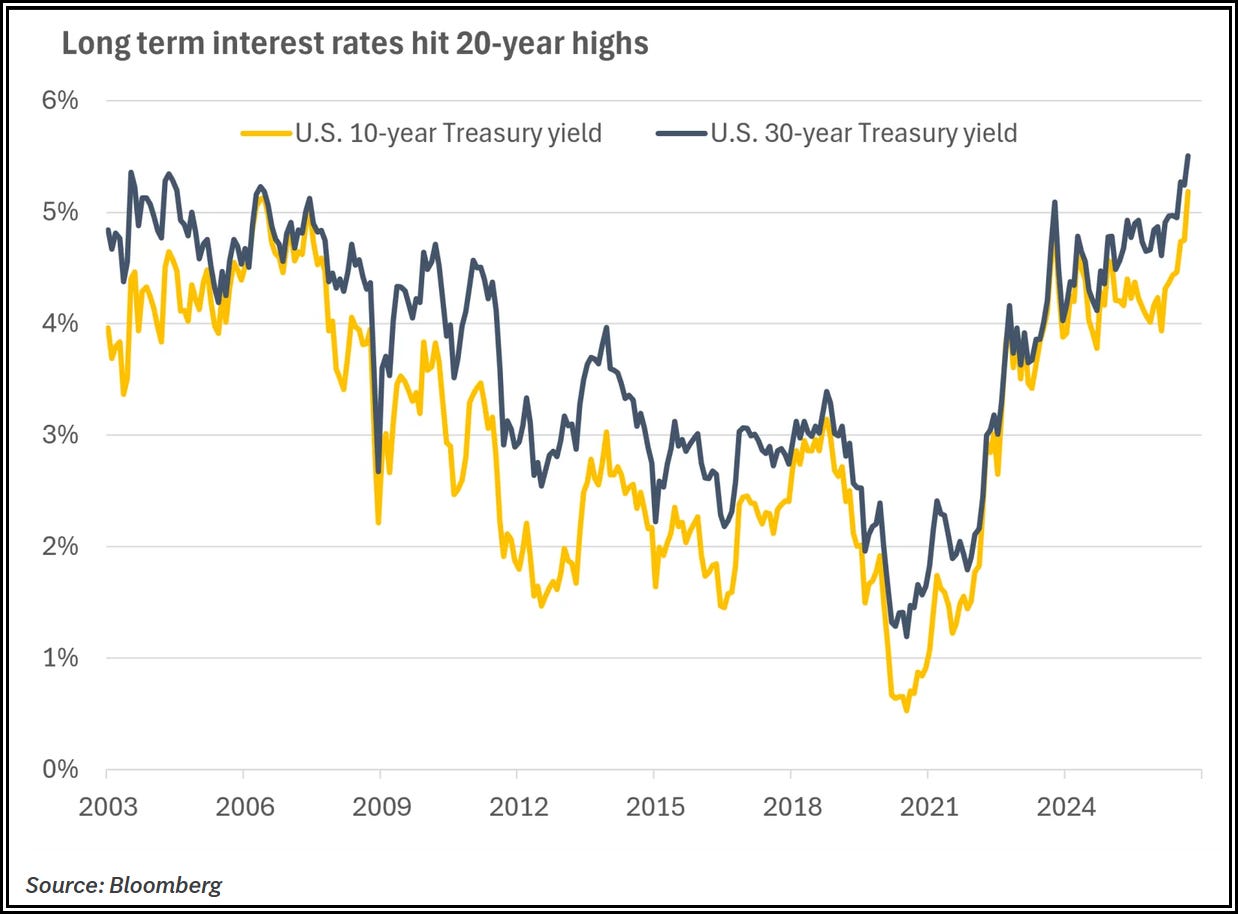
Wednesday showed exactly where the pain lives. As yields surged, the S&P 500 fell 0.8%, the Nasdaq declined 1.1%, and the Russell 2000 dropped 1.8%. Utilities, real estate, homebuilders and other rate-sensitive groups were hit particularly hard.
Higher rates are not affecting every company equally. Businesses with strong balance sheets, abundant free cash flow and powerful secular growth have been considerably more resilient than companies dependent upon inexpensive financing.
They are not immune. They are simply less sensitive.
The inflation picture may also be more nuanced than the headlines suggest. Measures that strip out the recent energy shock point to underlying inflation closer to 2.4% year over year, arguing against a simple repeat of 2022. The larger market problem may be rates remaining high enough — or rising quickly enough — to keep pressuring weaker balance sheets.
If yields rise far enough or fast enough, even the strongest leaders can eventually come under pressure. Until that starts showing up in the tape, however, there is little reason to assume it must happen simply because the macro argument says it should.
AI may be contributing to the divide as well. Heavy investment is supporting economic activity while many of the largest beneficiaries are financially strong enough to absorb higher rates.
Interesting context.
But it is still context.
The Index Is Fine. The Average Stock Isn’t.
This is where the market gets much more interesting.
The latest breadth readings make the internal damage clear:
Above 10-day MA: 32.8%, +3.8 percentage points over five days
Above 50-day MA: 28.2%, -3.1 percentage points
Above 100-day MA: 34.8%, -3.6 percentage points
Above 200-day MA: 41.2%, -2.0 percentage points
But even those readings understate what has already happened.
The median S&P 500 constituent is roughly 16% below its own 52-week peak, and about 40% of stocks are already more than 20% below their highs.
Meanwhile, the S&P 500 itself is barely off its record.
That is the hidden correction.
Index concentration helps explain the disconnect. The top 20 S&P 500 stocks now carry roughly the same index weight as the bottom 480 combined, allowing strength in a relatively small number of companies to hide considerably more damage underneath.
Exceptionally low stock-to-stock correlation has helped too. Six-month realized correlation is reportedly near 5%, meaning large moves in individual stocks are often offsetting one another before they reach the index.
The danger is not low correlation itself.
The danger is what happens if a common pressure — most obviously another disorderly rise in yields — causes leaders and laggards to begin moving lower together.
We can see another version of that disconnect in volatility. Treasury volatility has already increased sharply while the VIX remains unusually subdued. Low stock-to-stock correlation has helped keep index volatility contained, but if rates begin affecting more stocks in the same direction, that cushion could disappear quickly.
The market may be storing up the potential for significantly greater volatility ahead.
Very short-term breadth is trying to improve. Friday’s advancing stocks beat decliners nearly 2-to-1 and seven of eleven sectors finished higher.
But the S&P 500 still produced 31 new lows against only three new highs, while Nasdaq recorded 175 new lows versus 54 new highs.
So Friday was better.
It just wasn’t enough.
Breadth improved. Breadth did not confirm.
Many individual stocks and rate-sensitive groups have already absorbed substantial damage while the remaining leaders continue holding together.
That puts us much closer to the decision point that matters.
The troops have already taken considerable damage. The question now is whether buyers return — or the last remaining generals get shot.
Money Is Coming Back — But Selectively
U.S. equity funds attracted $37.6 billion during the week, their first weekly inflow in five weeks and the largest since June.
But look where the money went.
Large-cap funds received $36.62 billion. Technology attracted $4.89 billion.
Small-cap funds lost another $1.02 billion.
Investors are not broadly buying weakness yet. They are still sending capital toward the areas already displaying strength.
If the internal correction is beginning to heal, we should eventually see that demand spread.
Credit Is Not Confirming a Bigger Problem — Yet
Credit offers an important counterpoint to all the weak breadth.
Absolute borrowing costs are already high, with investment-grade yields approaching 6% and leveraged loans around 10%, yet credit spreads remain relatively contained.
That suggests the market is dealing with expensive money rather than broad financial distress — for now.
The distinction matters. High Treasury yields pressure valuations and financing. Materially widening credit spreads would tell us something more serious is happening.
Until that changes, the evidence still looks more like a rolling correction than systemic stress.
Small Caps and Financials Still Have Something to Prove
The Russell 2000 finished the week lower despite the S&P 500’s gain, again demonstrating where higher rates are biting hardest.
Roughly 30% of smaller companies have variable-rate debt compared with only about 6% of large companies, making smaller businesses much more immediately exposed to rising borrowing costs.
That does not mean small caps cannot become attractive.
It means being down a lot is not, by itself, a reason to buy them.
Cheap can stay cheap. We want to see demand return.
Financials also declined 1.6% for the week, and the weakness has now erased the sector’s year-to-date gain.
Banks, regional banks, insurers and asset managers remain useful tells. If they begin repairing, that would be constructive. If they continue deteriorating, the pressure remains unresolved.
Oil Gave Us Relief. Now It Has to Hold.
WTI finished the week near $92, easing one of the pressures that had been pushing inflation expectations and Treasury yields higher.
But Friday’s relief now faces an immediate test.
President Trump said Saturday that he rejected Iran’s latest proposal to reopen the Strait of Hormuz and resume negotiations, reducing some of the diplomatic optimism that helped pressure oil late in the week. Iran’s proposal had linked reopening the strait to easing U.S. military and economic pressure.
Meaningful volumes of crude are still moving through Hormuz, so this is not the same thing as another supply shutdown.
Still, oil will be one of the first important prices to watch when trading resumes.
If crude quickly reverses Friday’s decline, rate and inflation pressures could return to the foreground.
If oil absorbs the news and stays contained, that tells us something too.
Cross-Asset Check
The weakness beneath the indexes deserves respect, but before concluding that something more serious is developing, it helps to look beyond stocks. If a broader risk-off transition were taking hold, we would expect to see confirmation from other asset classes as well.
Commodities
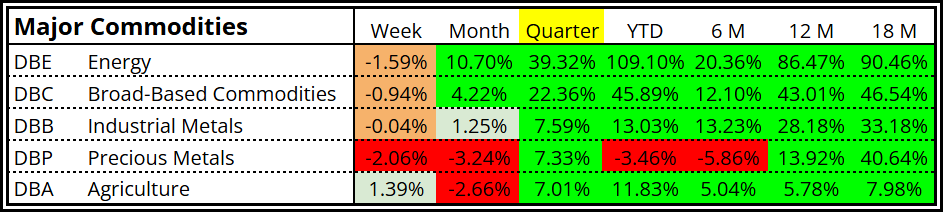
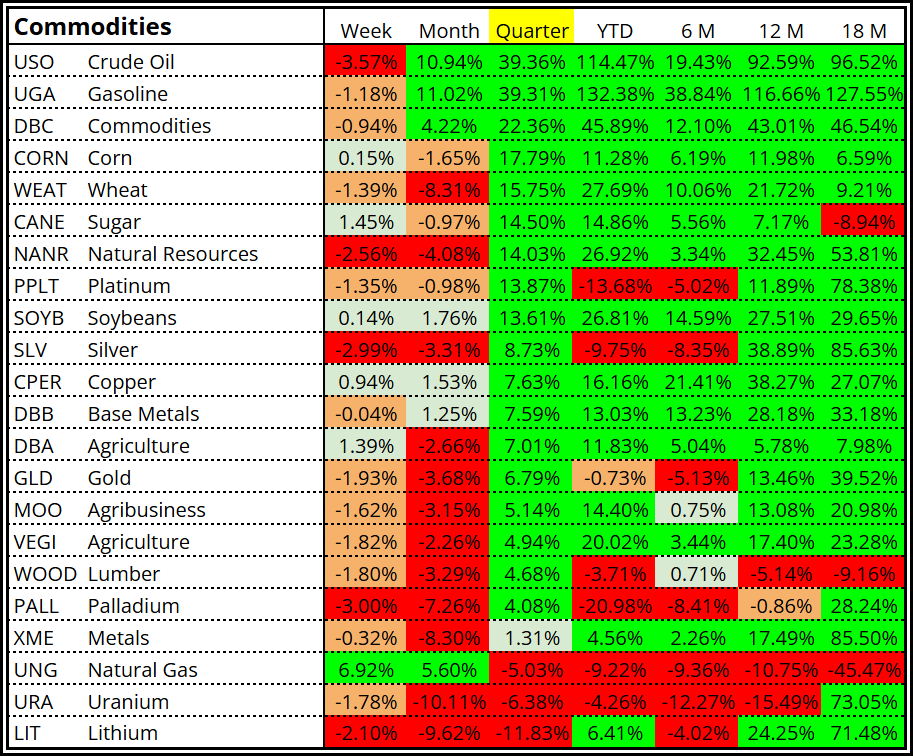
Commodities give us another read on inflation, global demand and investor positioning. Oil remains especially important because of its influence on inflation and interest rates, while metals and other commodities can tell us whether the message is broader than energy alone.
The longer-term strength remains concentrated in energy and the broader commodity complex. Energy is up +39.32% for the quarter and +109.10% year to date, while broad-based commodities are up +22.36% for the quarter and +45.89% year to date.
But the short-term picture is much less uniform. Crude oil fell -3.57% for the week, precious metals declined -2.06%, gold fell -1.93%, and silver dropped -2.99%, while natural gas moved sharply higher at +6.92%.
For now, commodities are showing rotation and crosscurrents rather than the kind of broad defensive move we would expect if investors were aggressively preparing for a major equity-market breakdown.
Currencies & Crypto
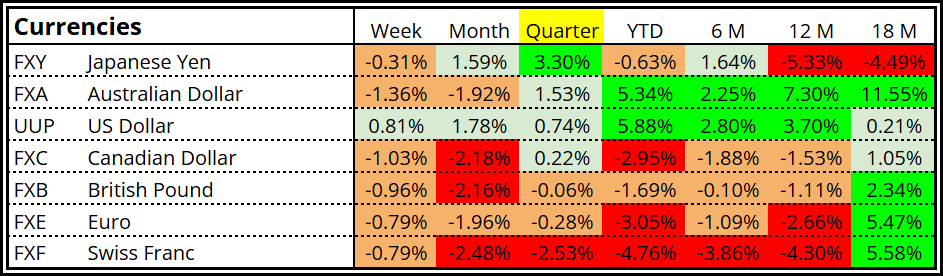
Currencies and crypto provide another useful look at global capital flows and risk appetite. The dollar and traditional safe-haven currencies can strengthen when investors become more defensive, while crypto often reacts quickly when appetite for risk changes.
The U.S. dollar gained +0.81% for the week and is up +5.88% year to date, while the Japanese yen and Swiss franc — currencies often associated with defensive positioning — failed to show comparable short-term strength.
Meanwhile, crypto moved in the opposite direction of a classic risk-off trade. Bitcoin gained +3.37% for the week, the broader crypto basket rose +3.91%, and Ethereum added +1.96%. All three have also posted substantial gains for the quarter.
A stronger dollar alongside rising crypto is an unusual combination, but it is not what we would expect to see if investors were broadly rushing for safety.
So far, the message is not one of broad risk aversion.

International Markets
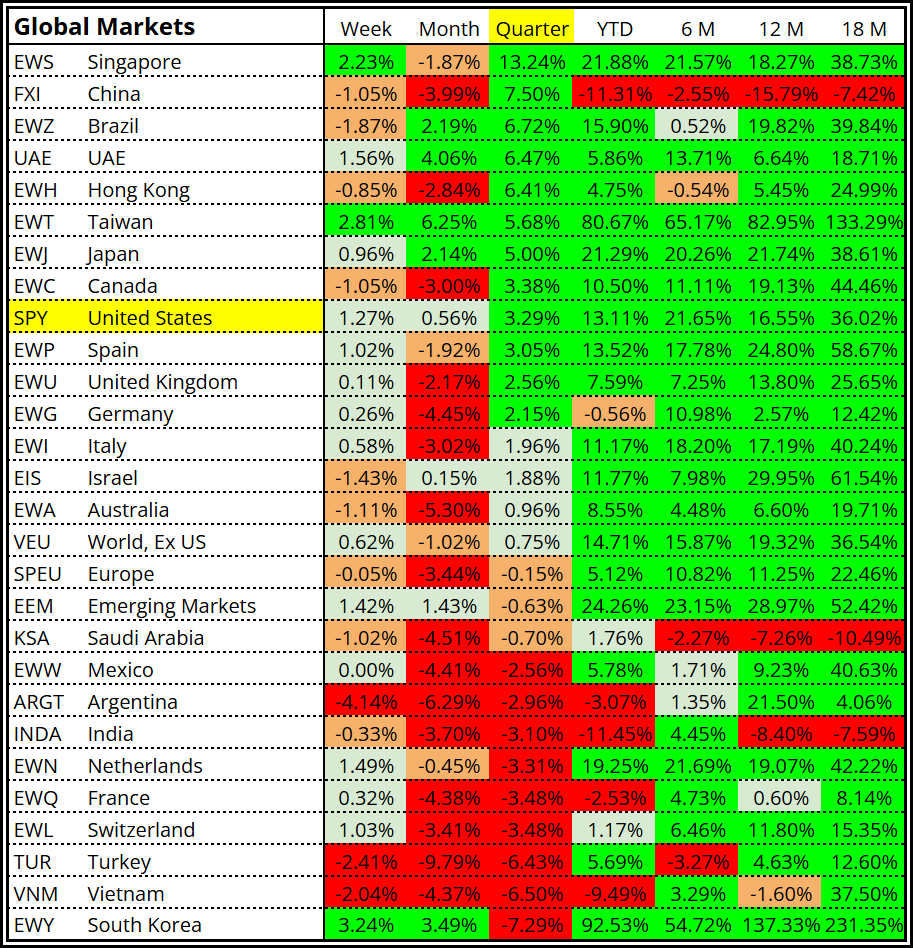
International markets help us determine whether the concentration we are seeing in U.S. equities is part of a broader global pattern or primarily a domestic one.
There are pockets of impressive strength outside the United States. Singapore gained +2.23% for the week and is up +13.24% for the quarter, while Taiwan rose +2.81% for the week and remains up an extraordinary +80.67% year to date. Japan is also positive across the week, month and quarter, while China remains up +7.50% for the quarter despite recent weakness.
But this is not broad-based global strength. The World ex-U.S. index is up only +0.75% for the quarter, Europe is down -0.15%, and Emerging Markets are down -0.63%.
So the international picture looks much like the U.S. market: leadership exists, but it is selective. If that strength begins spreading while weaker areas of the U.S. market repair, it would support the idea that we are seeing rotation rather than the start of a broader breakdown.
The Hedges Aren’t Confirming a Broad Risk-Off Move
This may be the most interesting cross-asset test of all. If investors were becoming increasingly convinced that something much more serious was developing, we would expect traditional hedges and crisis-oriented trades to begin showing persistent relative strength.
So far, that confirmation is largely missing.
The exception is small caps. TZA, the leveraged Russell 2000 bear fund, is up +11.67% for the month and +19.89% for the quarter, reinforcing what we already know: considerable damage has occurred beneath the large-cap indexes.
But the broader fear trade has not taken hold. VIX-related products remain weak, while bearish bets against the Nasdaq, S&P 500 and FANG stocks have also failed to develop sustained relative strength.
That does not erase the weakness beneath the indexes. It tells us something more specific: the market is confirming stress in weaker areas, particularly small caps, but it has not yet confirmed a broad risk-off regime.


The Leveraged Bulls Are Telling the Same Story
The leveraged side of the market provides another useful confirmation of where strength remains concentrated.
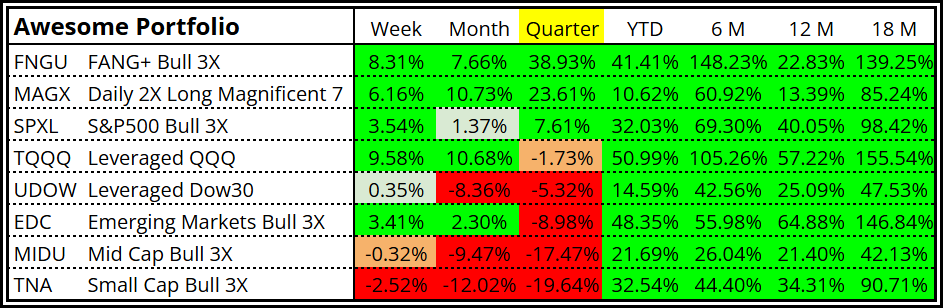
FANG+ gained +8.31% for the week and is up +38.93% for the quarter, while the 2x Magnificent 7 fund gained +6.16% for the week and +23.61% for the quarter.
Leveraged S&P 500 exposure also remains positive for the quarter at +7.61%.
The contrast farther down the market-cap spectrum is striking. Leveraged Mid Caps are down -17.47% for the quarter, while leveraged Small Caps have fallen -19.64%.
Even when we turn up the leverage, we get the same message: large-cap growth is being rewarded while smaller companies continue to absorb the correction.
A Few Other Tells
Software remains selective rather than broadly strong. Companies tied most directly to AI infrastructure, agentic AI, cybersecurity and other areas where spending remains strong continue to attract interest, but investors are not indiscriminately buying the entire software complex.
The bond market also remains important. Treasury demand has been less enthusiastic as yields have climbed, and elevated bond volatility continues to contrast with relatively subdued equity volatility. That disconnect can persist, but it remains something we should watch closely.
Economic signals are mixed rather than recessionary. Unemployment claims remain low while consumer sentiment is weak, giving us another reminder that the economy, the markets and how people feel about them do not always move together.
None of these crosscurrents gives us the answer by itself. Price still does.
What This Week Really Told Us
The most important lesson from this week is that we do not have one market. We have several markets sitting on top of each other.
The S&P 500 remains near a record high, but roughly 40% of stocks are already more than 20% below their own highs. Large-cap growth continues to carry much of the load, while smaller companies and many rate-sensitive areas have already experienced substantial corrections.
The performance tables reinforce that conclusion from nearly every angle. Large Cap Growth is the only major size/style category positive for the week, month and quarter. Within the Magnificent 7, leadership is rotating rather than disappearing. And semiconductors continue to provide some of the strongest short-term momentum.
But we are also beginning to see hints of something potentially more important: repair.
Biotech, airlines and homebuilders were among the groups showing improvement this week despite substantial prior damage. Within individual stocks, names such as MCHP, TXN, CRDO, ALAB, AMGN, MRNA, COST and DAL are worth watching for additional evidence that buyers are beginning to return to previously damaged areas.
One good week does not make a trend. We want higher lows, reclaimed levels and follow-through. Stocks are not attractive simply because they have fallen.
The cross-asset evidence adds another layer. Commodities are mixed rather than signaling broad defensive positioning. The dollar strengthened while crypto also rallied. International leadership exists, but it remains selective. The traditional hedge and doomsday trades are not showing broad, persistent relative strength, with bearish small-cap exposure the notable exception.
Even the leveraged bullish products tell us the same story: large-cap growth is being rewarded while smaller companies continue to absorb the correction.
Put it all together and the market is giving us a surprisingly consistent message:
There has already been considerable damage beneath the indexes, but the evidence still looks more like a concentrated correction than a broad risk-off regime.
That makes the next phase especially important.
If damaged areas continue to repair while the existing leaders remain strong, the correction may be considerably further along than the major indexes suggest.
If that repair fails and the remaining leaders begin breaking down, the low-correlation cushion that has hidden much of the damage disappears.
We don’t need to guess. Price will tell us.
From Analysis to Action
We have now established the important part of the backdrop.
The indexes remain strong, the correction underneath them is real, leadership is concentrated but still intact, and there are early signs that buyers may be returning to some of the areas that have already absorbed the most damage.
That tells us where we are.
Now we need to decide what would make the next move actionable.
For members, we’ll turn the evidence into a practical roadmap for the week ahead: the developing S&P 500 reversal setup, the price levels that would confirm or weaken it, what we need to see from breadth and leadership, the catalysts that could move the market, and our legendary Bull, Base and Bear scenarios.
The market is close to giving us an answer.
The rest of this report is reserved for paying subscribers.
Below, I’ll lay out what would make this setup actionable, what could change my mind, and what will be front and center for me when the market opens Monday morning and throughout next week.