

Two Targets Captured. Next Target +3% Away
This week we focus on the potential for the third target capture vs potential for consolidation.

“You can't hit a target you cannot see, and you cannot see a target you do not have."
- Zig Ziglar
The Price Action
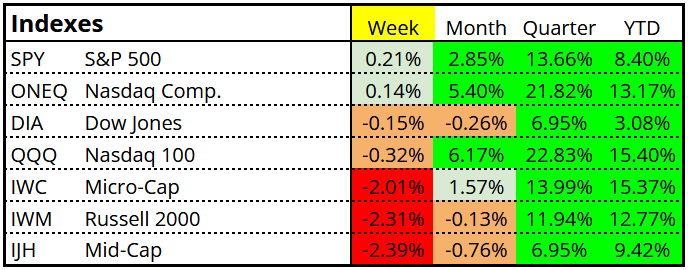
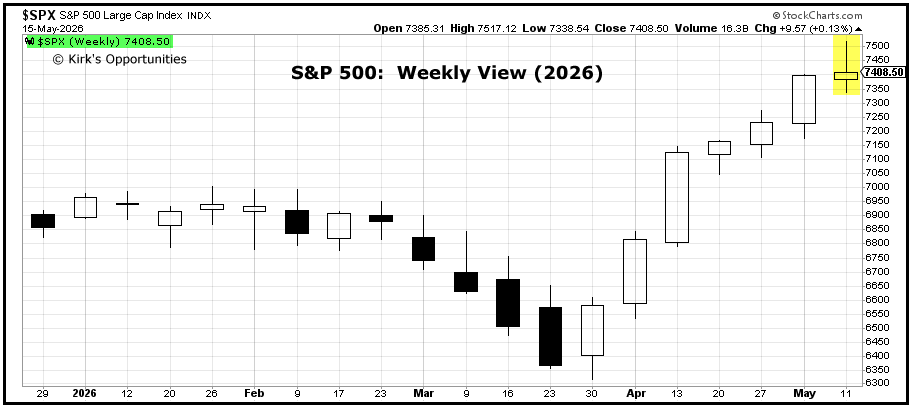
For the S&P 500 (and Nasdaq Comp.), the rally continued for its 7th straight week.
For the others, not so much:
At least for the S&P 500, the index we focus so much of our time and attention upon, it has proven to be a highly unusual period of persistent strength seldomly seen for most of us during our lifetime:
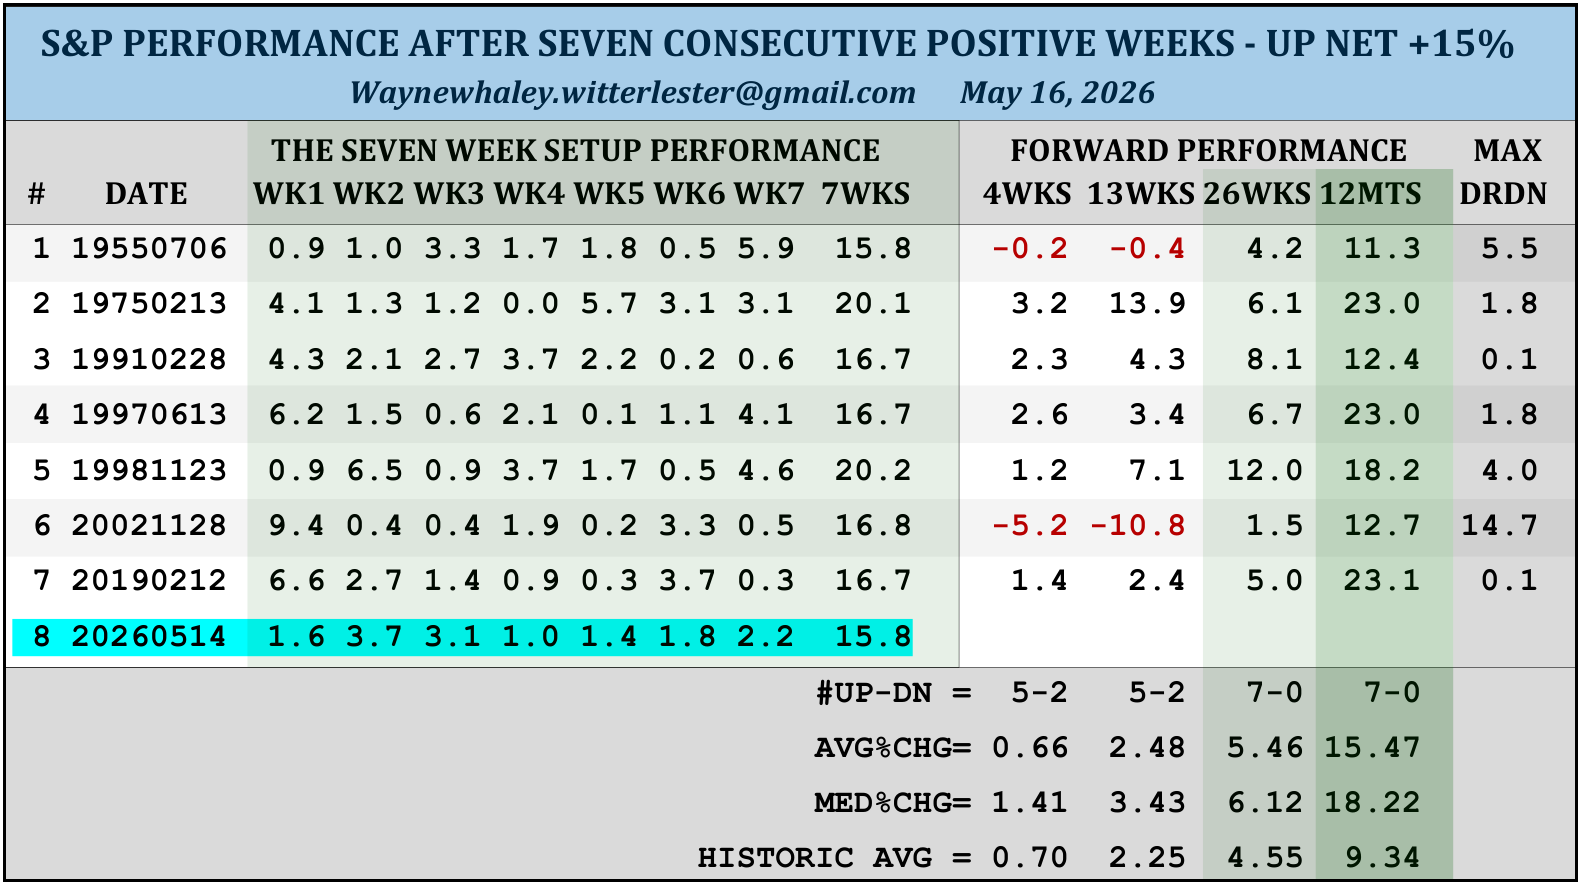
This price study, like many I have seen, evaluated and shared in my notes, reflects the market’s potential for the uptrend and price action strength to continue.
This is undeniably, an attractive risk/reward setup.
Especially when there is the price action foundation laying the path higher for longer and price action plays consistently play out successfully.
Two Target Captures
In the past week alone, the S&P 500 captured its next two out of three target objectives.
The first was the this year’s Fibonacci extension target at 7425 last Monday:
The second target was the long-term range breakout target at 7459 formed by last year’s -19% correction, then v-shaped recovery and sustained breakout that has been in our crosshairs since last June:
Third Target In Play
This leaves this year’s range breakout play targeting 7688 in focus.
This target (as shown in the chart above) was constructed by the size of the trading range formed by the -9% pullback in March and then extremely fast, three week v-shaped reversal and breakout above S&P 7002. This provides a measured move target which is +3.78% above last week’s close (5/15/26).
A target which is likely to be captured in the continued absence of strong and sustained price action deterioration showing increased vulnerability at these higher highs.
Before rallying up above 7500 for the first time ever last Thursday, the only minor dip we saw was on briefly on Tuesday morning which was bought very quickly and aggressively:
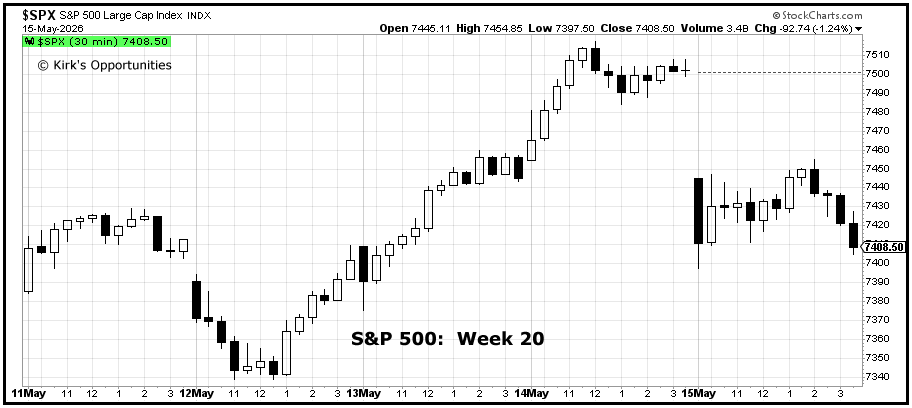
To be fair, options expiration Friday played out differently.
Stocks gapped down at the open, attempted to rally, but failed to bounce back. Uh-oh!
What has resulted is a potential shooting star formation on the weekly time frame. Even though these shooting stars usually end in a red candle representing a down tick versus a modestly positive one like last week. But, nevertheless still worth keeping an eye on. At least to see if there is any follow through confirmation.
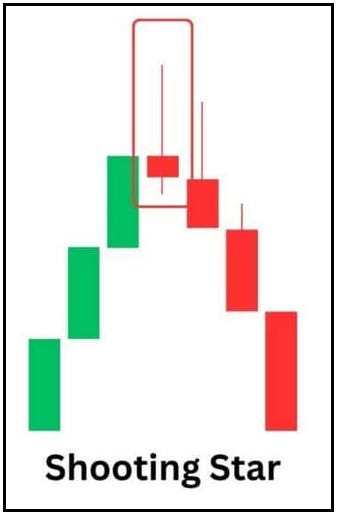
Needless to say, a one day reversal (and its impact on the weekly candlestick), on options expiration Friday, which is well-known for its fake outs, false moves and unreliable price signals, does not indicate it is time to sell and run for cover.
Let’s take it one day, one week at a time, and avoid overthinking it.
What About Bad Breadth?
Additionally, there has been, and continues to be, a tremendous amount of worry the major market-cap indexes do not reflect the entire market and that, upon closer inspection there is more underlying weakness than this persistent rally indicates.
This is why many active investors keep close watch on breadth showing how many stocks are participating in the move. The more strength the better. There is plentiful research backing that view. Additional, there are studies if you want to find them, which surround many of the positive price action studies into question.
For example, the following study I shared last week in my notes:
Yet, all conditions like this require price action to confirm them for them to become actionable. Even in the study above, the worst performing periods which follow saw price begin to confirm the vulnerability before largest declines followed.
Other times, not so much. And, that’s the point!
If these bad breadth warnings are accurate, we will start seeing price action showing it through bull trap reversals lower lows, lower highs, and trendline breaks. Periods in which the selling lasts for more than a few, very brief hours.
None are present at this point.
Only consistently persistent, positive price action instead.
So, bottom line, we will focus on the price action as priority, even if it only reflects fewer and fewer stocks at the index surface due to the market cap construction.
The bullish price action foundation is in place laying the foundation +3.78% higher.
At least until price action proves otherwise.
Probabilities & Positioning
On balance and, in consideration of everything I’ve seen combined with the research I’ve undertaken in the past week, probabilities favor…