


Hi friends! 👋🏼
One of the more interesting developments this past week was what didn’t happen.
Semiconductor stocks took a beating, AI spending concerns resurfaced, Treasury yields reached new highs, and yet the broader market managed to finish higher.
The S&P 500 gained 1.2%, the Dow advanced 0.9%, and the Nasdaq Composite added 0.6%. The Nasdaq reached new record highs early in the week, while the S&P 500 closed above 7,800 for the first time.
Smaller companies weren’t invited to the party, however, with the Russell 2000 losing 0.9% and the S&P Mid Cap 400 finishing unchanged.
But here’s what caught my attention.
We’ve spent months hearing that this bull market is dangerously dependent on a handful of technology stocks. That’s a legitimate concern. Yet last week, some of those very stocks stumbled, and the broader market barely flinched.
For a bull market supposedly unable to stand without its technology leaders, that wasn’t a bad showing.
More importantly, despite the seemingly endless warnings about an approaching correction, the market continues to resist doing what the bears expect it to do.
That doesn’t mean they’re necessarily wrong about the risks. It means the price action has yet to confirm their concerns.
And that’s where I want to begin.
The Price Action: Still More Bullish Than Bearish
If this market is constructing a major top or preparing for a significant correction, I’m still waiting for the price action to provide convincing evidence.
So far this October, the S&P 500 has climbed back toward its August high near 7,816, briefly moving above that level last Tuesday.
That move substantially completed the right shoulder of the potential inverse head-and-shoulders formation we’ve been following, with upside targets near 8,035 and 8,057.
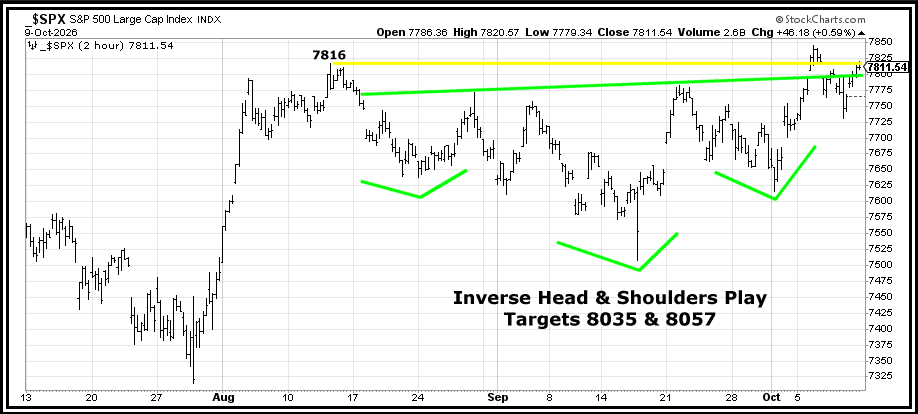
The first breakout attempt failed. But what happened afterward was just as interesting.
On the shorter-term chart, we can see the attempt to establish an island-gap bull trap reversal following Tuesday’s breakout. That’s precisely the kind of development I’ve been watching for as potential evidence of a change in the market’s character.
But the selling never developed into sustained downside follow-through.
Instead, buyers returned, and another short-term bear trap reversal emerged toward the end of the week.
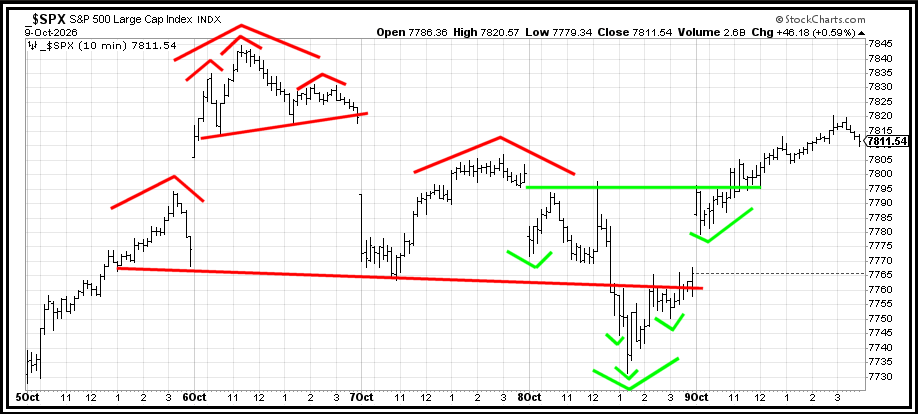
Once again, the market frustrated traders betting on an imminent breakdown.
This is becoming a familiar pattern. Breakouts struggle, breakdowns fail, and traders chasing either direction frequently find themselves on the wrong side of the next reversal.
It’s not necessarily the kind of price action that makes trading easy. But it’s also not what I would expect to see if sellers were firmly gaining control.
Failed breakouts are worth respecting. Failed breakdowns are, too.
When a market is moving sideways more than it’s trending, I find it helpful to simplify everything.
Forget the complicated patterns for a moment. Forget what everyone thinks should happen next.
Just put the price action into boxes.
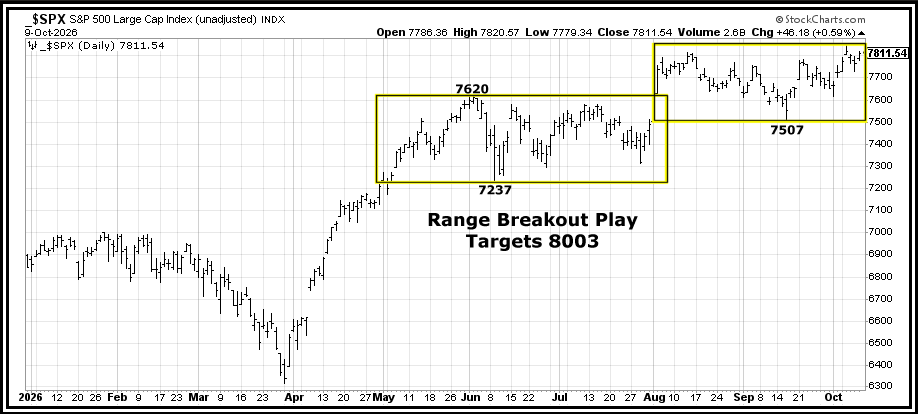
From that perspective, the larger bullish structure remains intact.
The September low near 7,507 is the first important support level I’m watching. Below that, the June low near 7,237 remains a much more significant reference point for the larger trend.
Meanwhile, the existing range breakout continues to suggest upside potential toward 8,003, with the inverse head-and-shoulders formation offering additional targets near 8,035 and 8,057.
Of course, those are potential targets, not promises.
But as long as the market continues to defend important support and refuses to establish a meaningful sequence of lower highs and lower lows, I believe it’s premature to declare a major top.
There’s a difference between recognizing that a market is vulnerable and having sufficient evidence to act on that vulnerability.
And right now, I still see a market that is considerably more resilient than the bearish narrative would have us believe.
What Changed Beneath the Surface?
The other encouraging development last week was the improvement in participation.
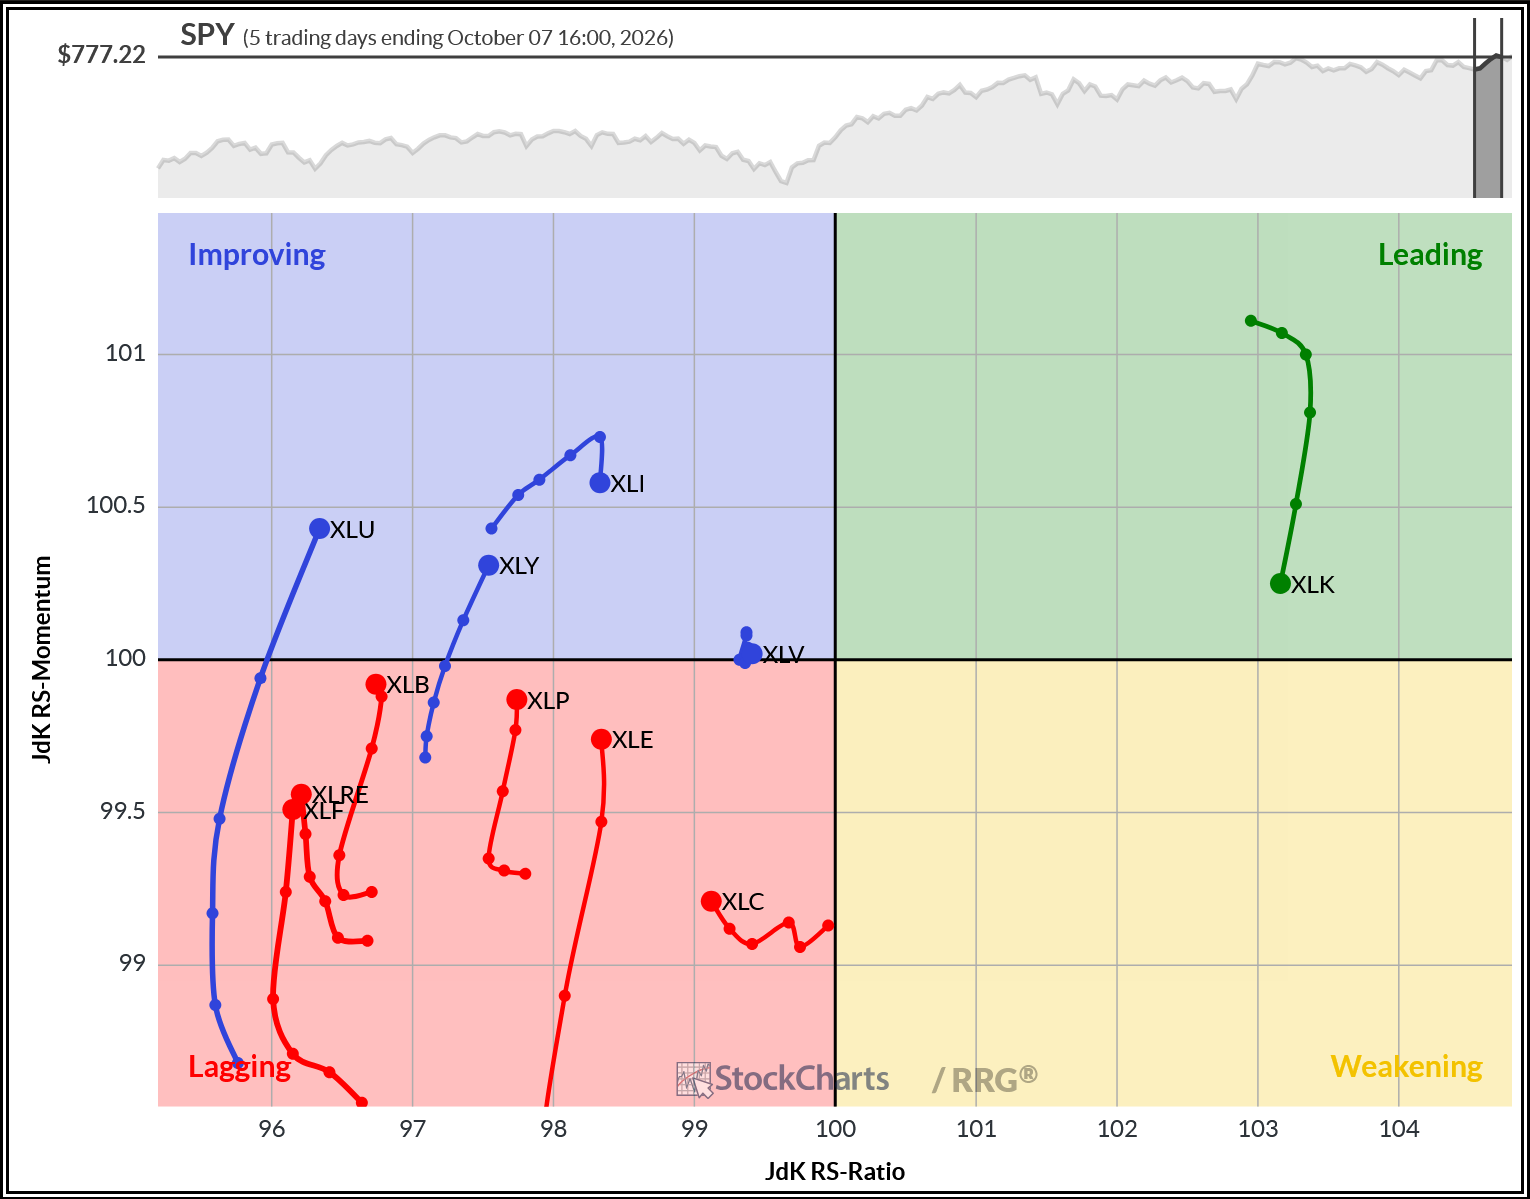
After seven consecutive losing weeks and a decline of roughly 7%, the equal-weighted S&P 500 (RSP) finally found its footing, gaining 1.6% and outperforming the major averages.
Nine of the eleven S&P 500 sectors finished higher.
Consumer staples (+4.0%), utilities (+3.9%), energy (+3.6%), consumer discretionary (+3.1%), health care (+2.8%), and financials (+2.3%) all posted impressive gains.
The following relative rotation chart provides a helpful picture of what was happening beneath the indexes.
Meanwhile, semiconductor stocks headed in the opposite direction.
Renewed questions about whether AI revenues can justify the enormous sums being invested in infrastructure helped send the PHLX Semiconductor Index down 4.3% for the week.
Treasury yields added another wrinkle. The 10-year briefly climbed to 5.36% on Wednesday, another high for the year, before retreating to finish the week at 5.24%.
Oil prices also remained volatile as developments involving Iran and the Strait of Hormuz kept traders guessing.
And yet, despite all this, the broader market advanced.
Now, I’m certainly not declaring victory for market breadth. Some of the strongest gains came from defensive sectors, and small caps continue to struggle.
A rotation into consumer staples and utilities isn’t necessarily the same thing as a healthy expansion in risk appetite.
But I also don’t believe we should dismiss improvement simply because it doesn’t fit the prevailing narrative.
There’s a meaningful difference between a market that depends on a handful of stocks to rise and one capable of holding its ground while those stocks take a breather.
Last week offered at least some evidence of the latter.
Whether we’re witnessing the early stages of healthy rotation, a temporary move toward safety, or something in between remains to be seen.
That’s a much more useful question than asking, for the hundredth time, whether the market is too concentrated.
About That Breadth Problem
I understand why investors remain concerned about the market’s historically poor breadth.
Past major market tops have frequently been preceded by deteriorating participation, sometimes months before the indexes themselves finally turn lower.
The historical research from Quantifiable Edges makes that risk difficult to ignore.
And last Tuesday offered another reminder. As the S&P 500 and Nasdaq attempted their breakouts, the weakness beneath the surface was difficult to miss.

But I keep coming back to a distinction I’ve emphasized throughout this bull market.
Bad breadth is a condition. It is not, by itself, an actionable sell signal.
For me, the signals come from the price action: successful bull trap reversals, rallies that repeatedly fail, lower highs, lower lows, important support breaks that hold, and the deterioration of established uptrends.
Do we have convincing evidence of those developments yet?
Not in the broader market.
That doesn’t mean we ignore the risks. It means we respect them without allowing those concerns to dictate decisions that price itself hasn’t justified.
As for last week’s rotation, earnings season may have played a role.
With expectations already extraordinarily high for many technology and AI companies, it would make sense for some investors to reduce exposure to potential disappointment while shifting toward sectors where expectations are lower and the possibility of positive surprises may be greater.
Whether that repositioning develops into a sustained change in leadership is one of the more interesting questions heading into the next few weeks.
Last week’s resilience was encouraging, but what matters now is whether buyers can build on it.
With earnings season beginning and important inflation data arriving, we’re about to get several opportunities to find out.
For members, let’s turn our attention to the week ahead, the specific setups I’m watching, and, most importantly, what would cause me to increase, maintain, or reduce exposure as the market makes its next move.
