
The Bottom Line
After eight straight weekly gains, the S&P 500 still has price-action support for higher highs, but the next phase depends on whether buyers can sustain the breakout, absorb rotation, and keep shallow pullbacks well-contained.
Eight-Week Streak Deserves Respect
I’m sure you’ve heard that markets climb the wall of worry.
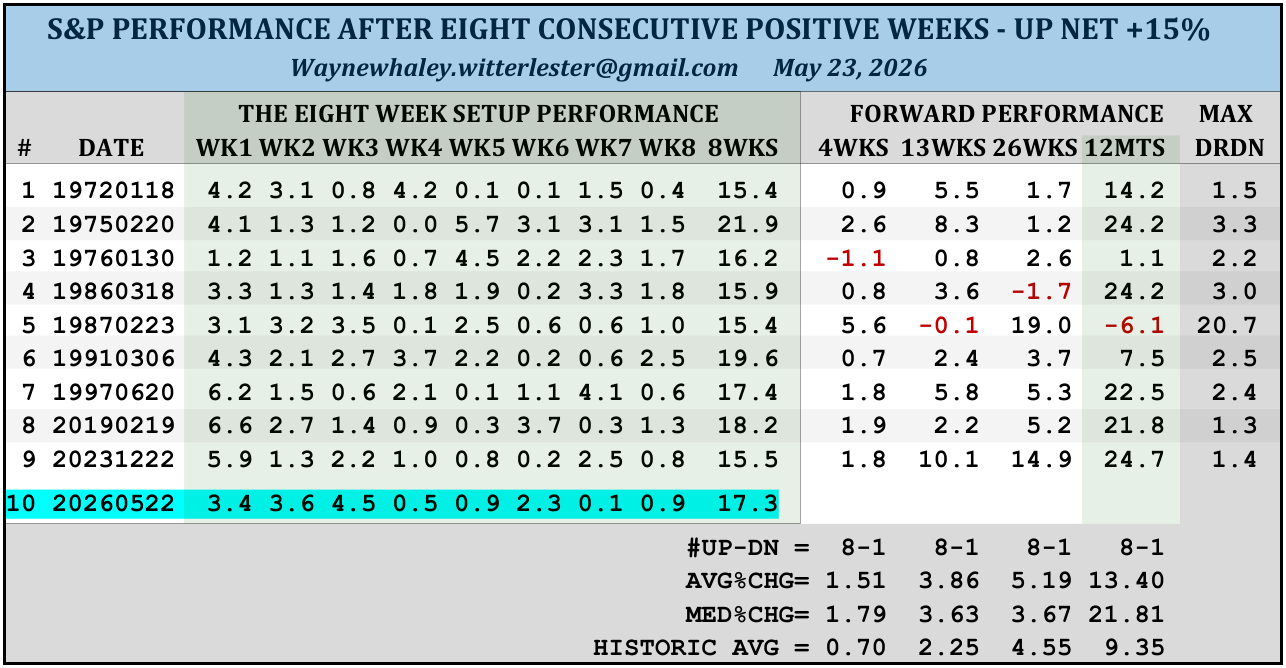
For this market, it has been a long, steady, and historic climb lasting 8 straight weeks and gaining +17.3%. Persistent strength like this has been seen only twice this century and only nine times in total since 1950:
As this study shows, forward performance following these winning streaks was strong:
Positive 8 out of 9 times, or 88.9%, one month later
While the average 1-year gain was slightly less, 5 of the 9 times it was larger
Maximum drawdowns were modest with one exception - the 1987 crash (-20.7%)
The main takeaway is that what we have seen since the March low remains bullish until price action proves otherwise.
By another measure, this also ranks as the 20th strongest rally since 1950:
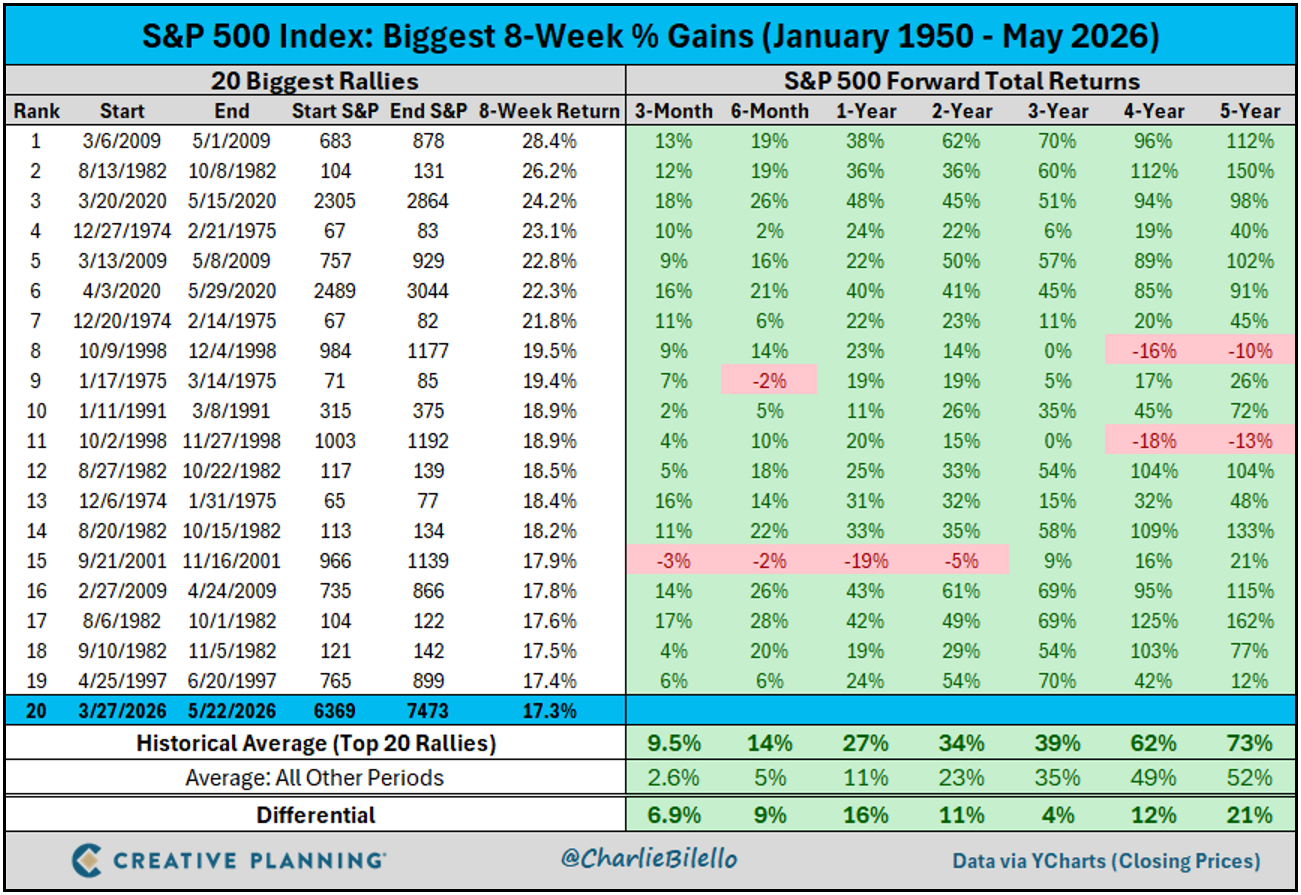
I share these studies for context, not certainty. The sample sizes are small, and we should always be careful about overfitting market history.
But the message is still useful: rare strength often leads to more strength, as long as price action continues to confirm the setup.
New Bullish Play
After capturing its two targets in the S&P 7,400 target zone during the seventh week of this winning streak, the post-target consolidation lasted only three days ending last Tuesday.
Like so many dips during this rally, the three-day pullback was limited to -2.4% before buyers stepped in.
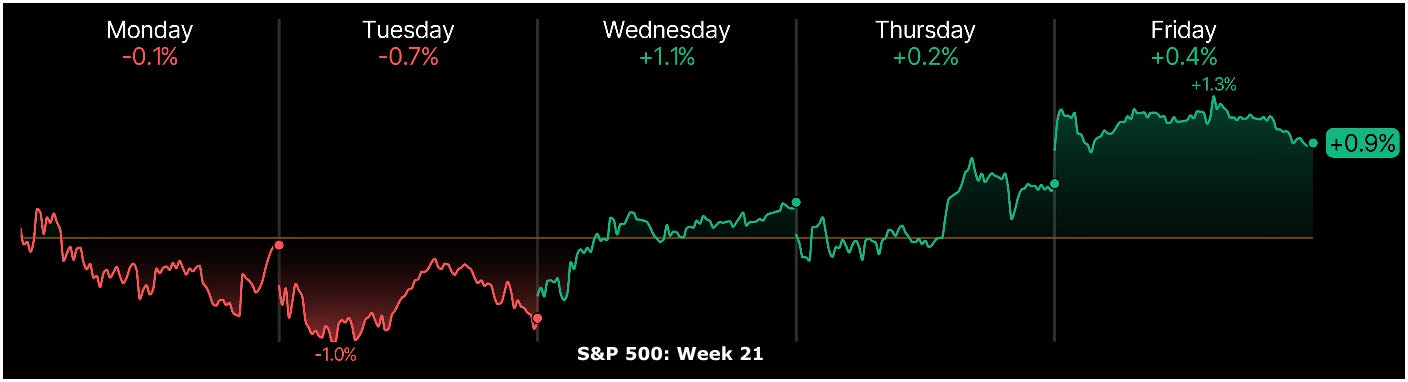
As I shared in the notes, the short-term price action was easy to read and evaluate.
A new short-term bullish reversal play formed, triggered, and then followed through last week. This new play successfully filled the May 15th gap before pulling back. More importantly, it also laid the foundation for a potential move toward S&P 7,533 and 7,575, or roughly +0.8% to +1.4% higher.
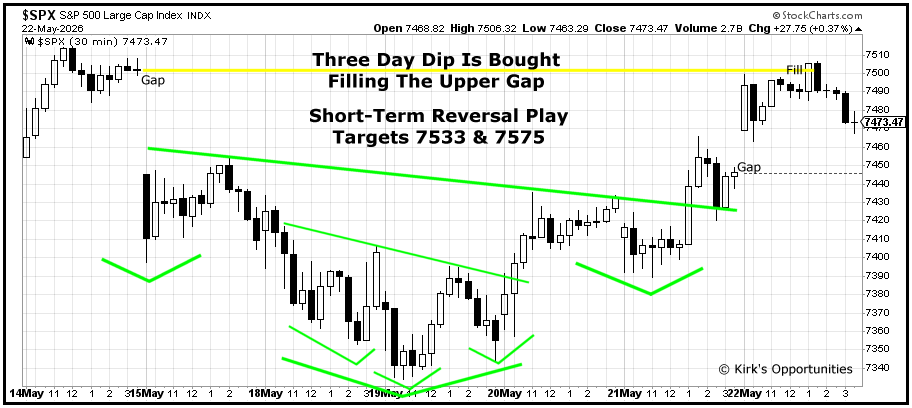
This shows the value of seeing periods of consolidation and minor dips along the way.
As long as the -2% to -3% dips continue to get bought, the path of least resistance is higher as strength continues to beget more strength.
This week, the key short-term test is straightforward: can the S&P 500 sustain a breakout above the May high at 7,517, or does it break below last week’s low at 7,333?
On a measured-move basis, a confirmed breakout would target 7,701, while a confirmed breakdown would target 7,149.
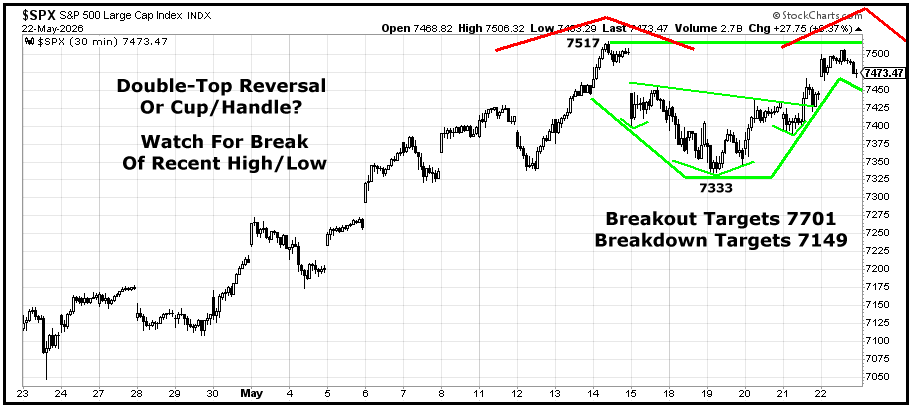
On a short-term basis, more sideways consolidation is always possible after a move like this. If there is a sustained break below last week’s low, I will also be watching to see if the rising 21-EMA provides trailing support above the first Fibonacci retracement:
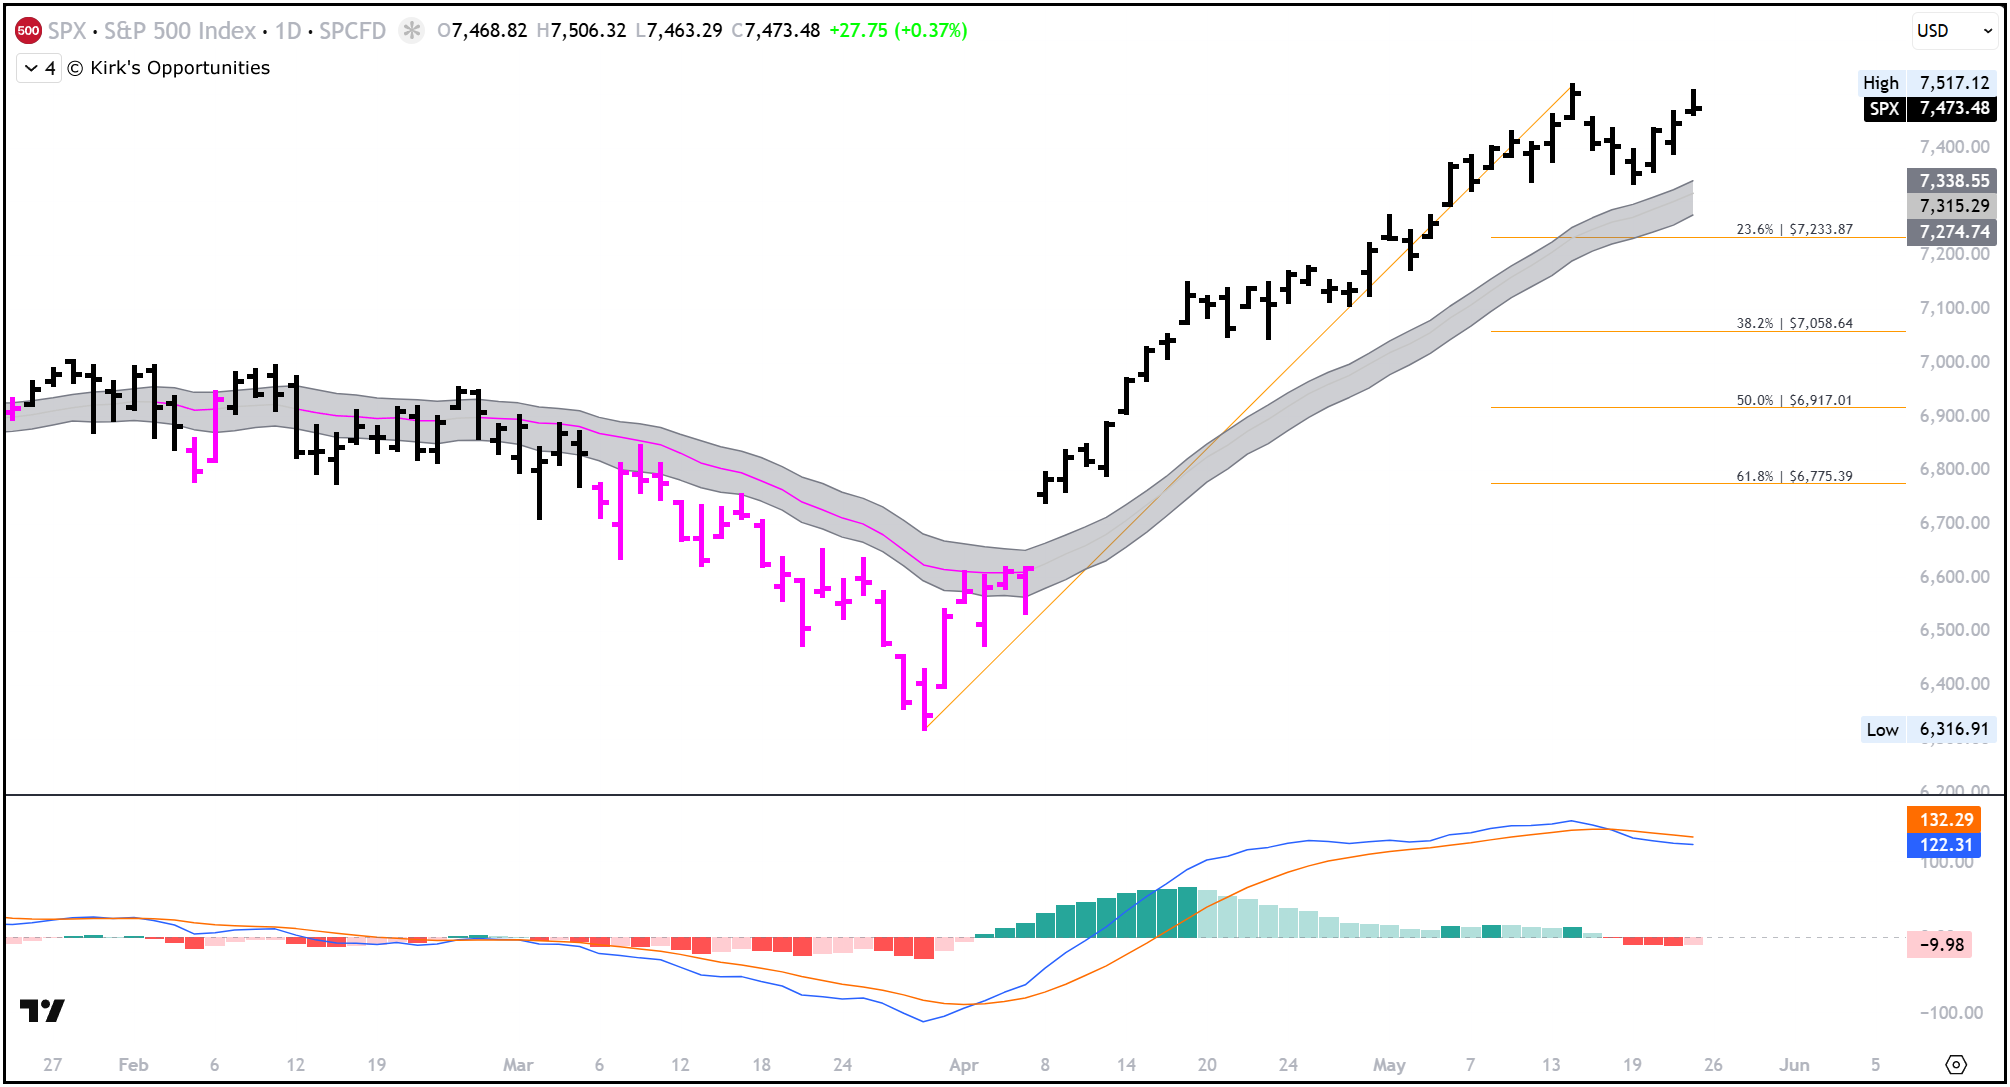
As long-time subscribers know, I have more confidence that a longer-term target will be captured sooner than later when short term bullish price action plays have also laid the foundation to, or just above, the same level.
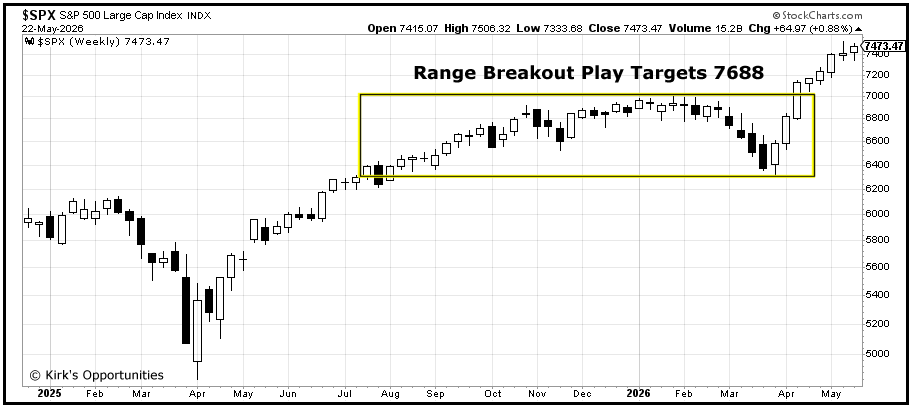
Right now, both the short-term and longer-term price-action foundations are pointing in the same direction: higher. The highest potential target is now 7,701, roughly +3% above current levels. If reached, that would also fulfill the final longer-term range-breakout target at 7,688 from the March pullback: