


Last week, the bears finally had something to celebrate. After months of watching stocks shrug off one warning after another, selling pressure is beginning to leave a mark on the S&P 500 and Nasdaq.
That raises the question I wanted to explore today: Is this another setback within the advance, or the beginning of a more significant correction?
Five Historical Comparisons
To put the recent weakness in context, I examined the historical years most closely correlated with this year’s S&P 500 performance.
The five closest matches were 1978, 1989, 2003, 2021, and 1997.
As the chart below shows, four of those five years finished above their mid-October levels. However, the closest match, 1978, was the exception. That year brought a much deeper autumn decline, followed by a partial recovery into year-end.
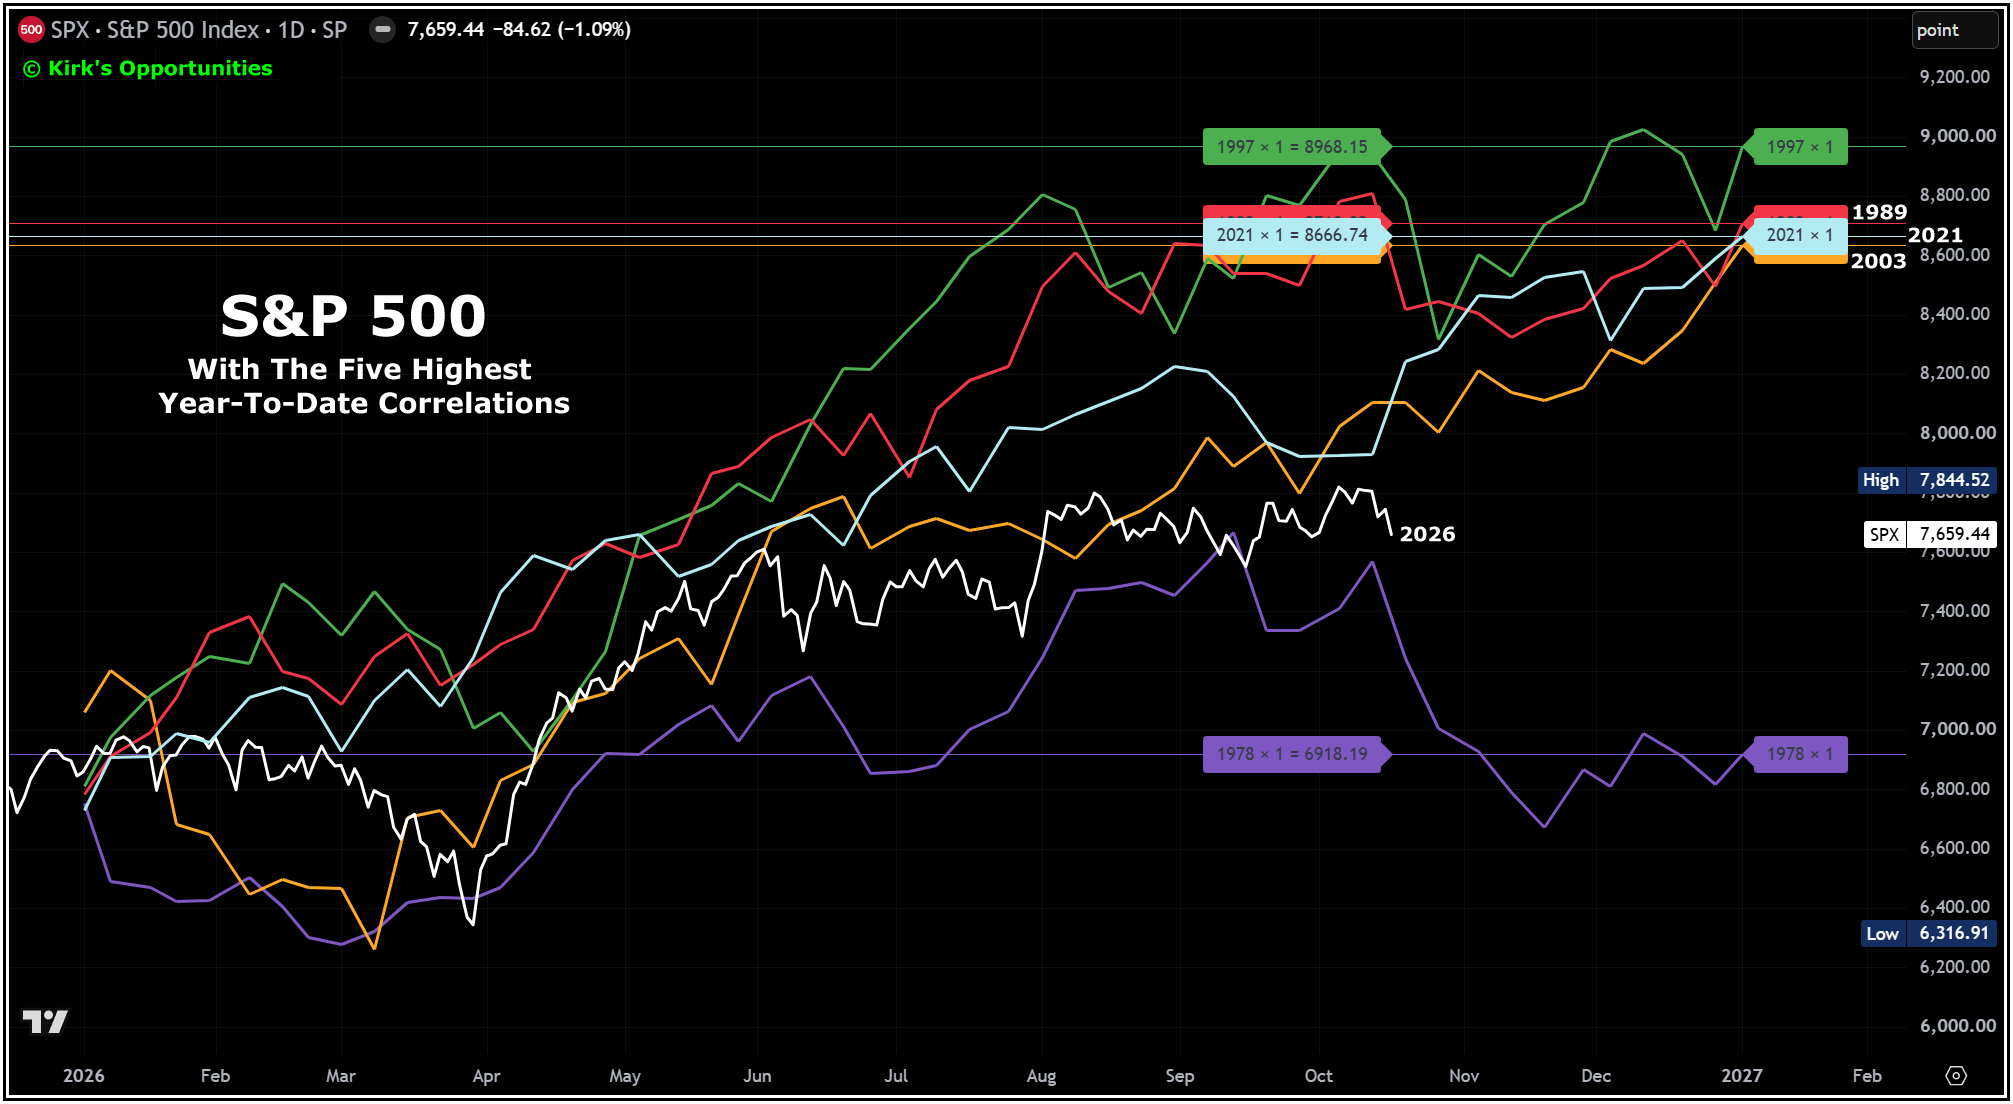
That contrast deserves attention, but it also requires perspective. Five selected comparisons do not establish an 80% chance of a rally. Nor does being the closest historical match make 1978 the most likely outcome.
These examples help us consider different paths and prepare for the risks along the way.
What Those Years Would Mean From Here
For the forward comparison, I measured each year’s S&P 500 price change from its October 16 close through its final trading day. When October 16 fell on a weekend, I used the preceding trading day, which was October 15 in 2021. I then applied each remaining-year return to last Friday’s S&P 500 close of 7,659.44.
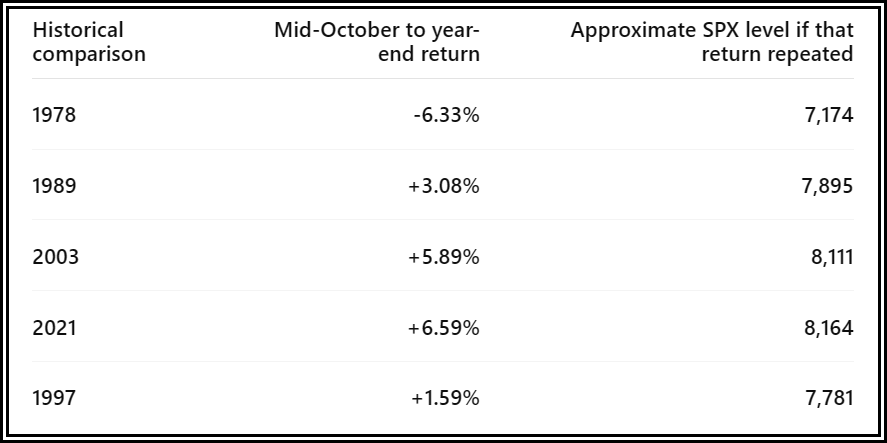
These are illustrative scenarios based on historical price returns, excluding dividends. They use a calendar-date cutoff and are calculated separately from the normalized full-year chart.
The exercise produces a range of year-end outcomes from approximately 7,174 to 8,164. That is a wide range, and it does not capture every possible outcome or the volatility we might experience getting there. Still, the next few weeks should offer clues about which paths remain plausible as price action develops.
Why 1978 Deserves Attention
In 1978, accelerating inflation prompted the Federal Reserve to intensify its tightening.
The Fed raised its discount rate from 8% to 8.5% on October 16, then to 9.5% on November 1. That was an increase of 1.5 percentage points in just 16 days, part of a broader effort to combat inflation and support the dollar.
Markets can absorb gradual, anticipated tightening. Rapid, aggressive increases are harder to digest, especially when investors are already questioning the outlook.
The S&P 500 fell approximately 13.6% from its September closing peak to its November 14 closing low. Some of that damage had already occurred by October 16. From that date, the remaining decline was approximately 9.9%.
Applying that remaining decline to last Friday’s close would put the S&P 500 near 6,904, followed by a partial recovery toward 7,174 by year-end.
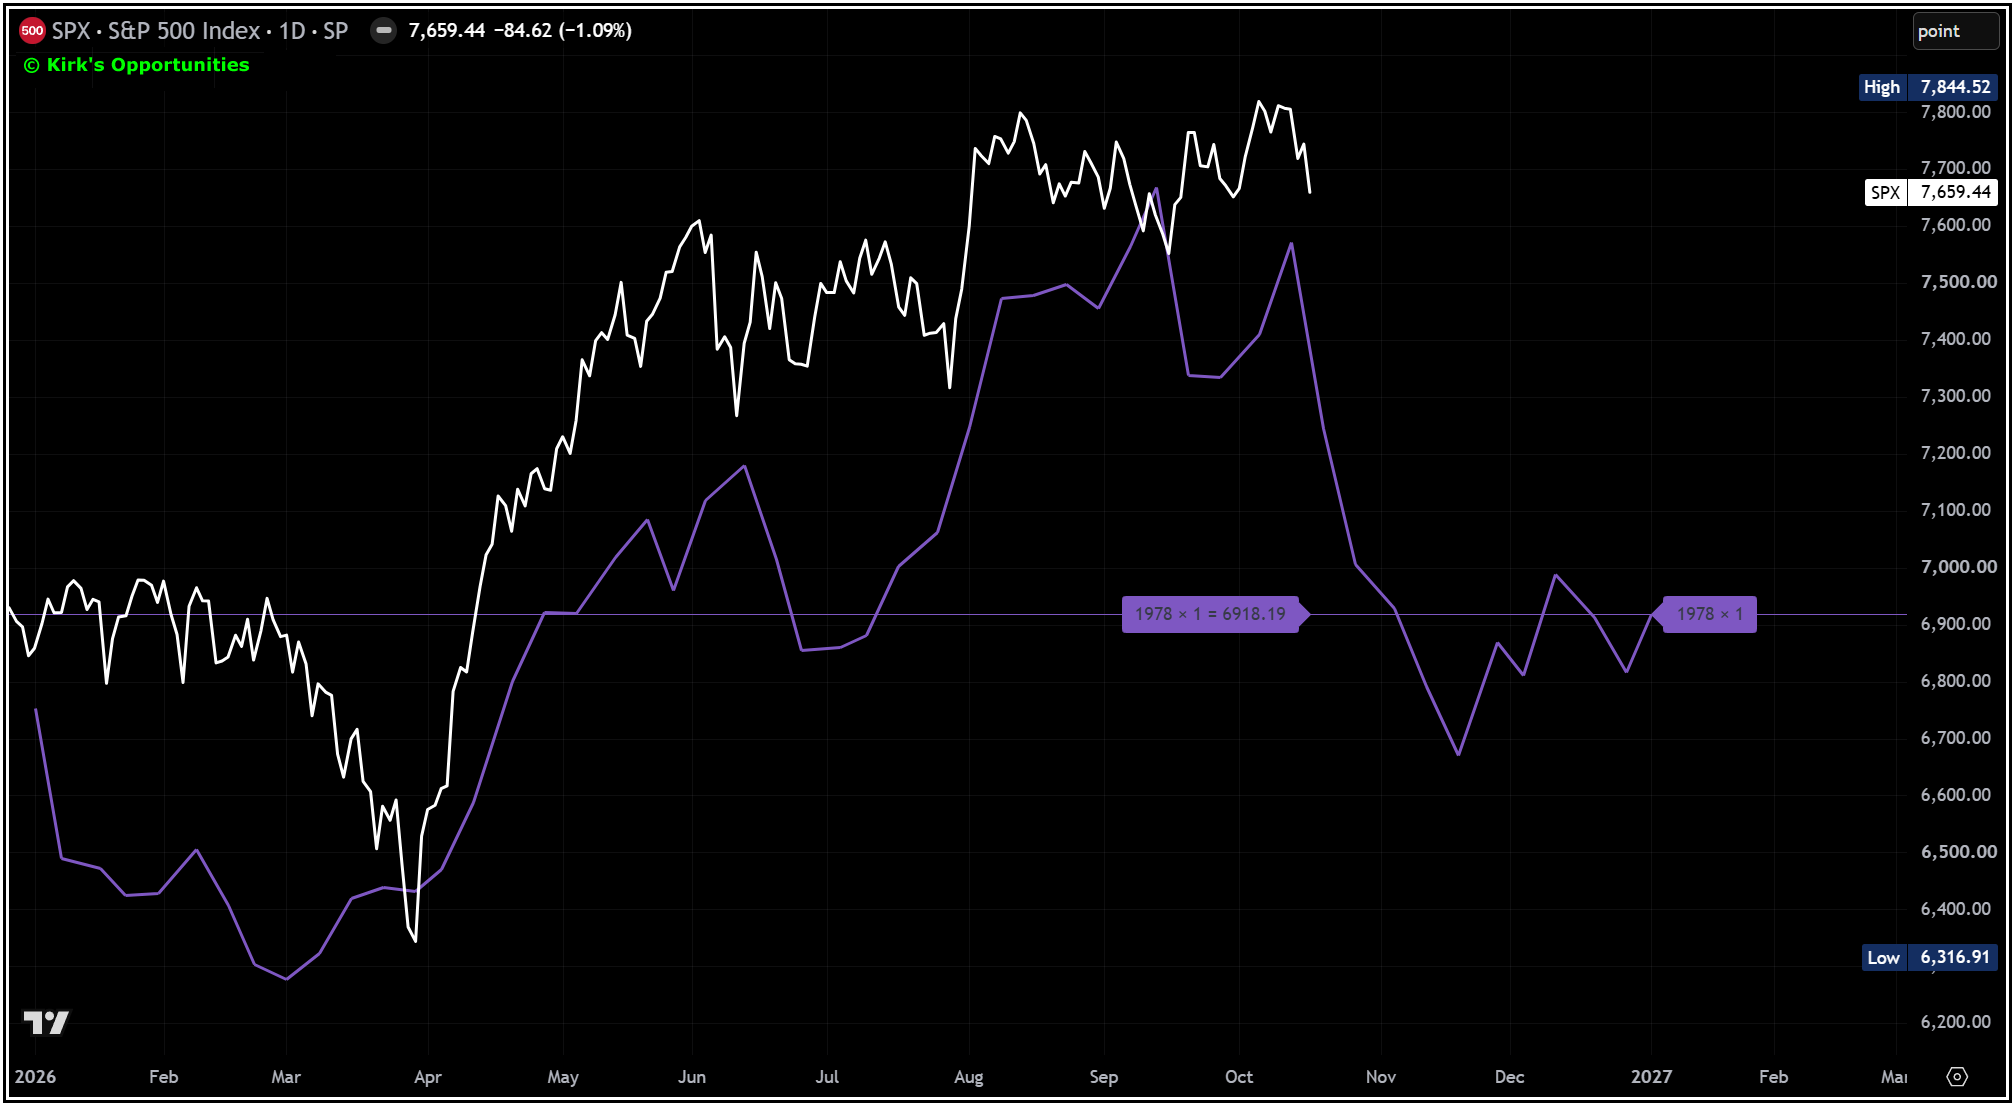
That is what makes this comparison worth examining beyond the resemblance between two charts: persistent inflation can force the Fed to keep tightening even as stocks weaken.
In other words, no Fed put.
The 1978 scenario becomes more concerning if renewed inflation pressure, further monetary tightening, and deteriorating price action begin reinforcing one another.
A market that has repeatedly rewarded buying weakness can eventually deliver a decline that takes longer to repair and costs more to sit through. The question is whether the evidence begins pointing in that direction.
What Happened In The Other Four Years?
The other comparisons offer more encouraging year-end outcomes, although some took difficult routes to get there.
1989: The October 13 mini-crash followed a financing setback for the proposed UAL buyout. The shock unsettled financial markets, but stocks recovered as the Federal Reserve continued easing policy. The S&P 500 finished the year above its mid-October level, although the recovery was uneven.
2003: Improving earnings, an economic recovery, and accommodative monetary policy supported a sustained advance. Stocks experienced pullbacks along the way, but the recovery gained ground into year-end.
2021: The S&P 500 rebounded from September’s weakness and advanced through much of the fourth quarter. Omicron concerns interrupted that progress in late November and early December, but the market recovered and finished the year near its highs.
1997: The Asian financial crisis produced severe October volatility, including the October 27 plunge that activated the NYSE’s circuit breakers. From October 16 through that October 27 close, the S&P 500 lost approximately 8.2% before eventually recovering to finish the year higher.
That last example deserves a second look. It belongs among the positive year-end outcomes, yet it still delivered a substantial decline first. A higher year-end close does not necessarily mean an easy ride.
The policy backdrop matters, too. These years did not share the same combination of inflation pressure and rapid Fed tightening that made autumn 1978 so difficult. Inflation was also a concern in 2021, but the Fed had not yet begun raising rates.
Iran adds another historical parallel, although the timeline matters. Unrest intensified during 1978, ahead of the revolution and the November 1979 hostage crisis. I was born in 1971 and still remember that crisis. It belongs to the broader backdrop of the period, but it should not be confused with the events driving the autumn 1978 decline.
What I’m Watching
History gives us several possible roadmaps. The market’s price action will tell us which direction we’re actually traveling.
Recent selling has done more damage beneath the surface than the S&P 500 alone suggests. To move away from the more troubling historical paths, I want to see improvement over the next few weeks: rallies that hold their gains, broken support levels that get reclaimed, and bullish reversals that follow through.
If rallies keep failing and breakdowns hold, the 1978 comparison becomes more relevant as a risk scenario.
We do not need to decide today whether 1978 is about to repeat. We need to recognize the range of outcomes and manage our exposure as the evidence develops.
Active investing depends far less on predicting the market than on keeping an open mind and adjusting to what is actually happening. What we think, want, or expect matters much less than what prices confirm.
For me, price action guides decisions. Historical comparisons help me consider what could happen if conditions deteriorate.
As an optimist by nature, I need that perspective. Optimism creates blind spots, especially after a long stretch in which buying weakness has worked. Studies like this remind me why I follow my stops and what ignoring them can cost.
C.E. Kirk
"What we learn from history is that people don't learn from history."
- Warren Buffett