

Throughout this quarter, the market has endured one bear raid after another. Even against that backdrop, last Thursday’s price action ranks among the most surprising reversals I can remember.
First came Wednesday’s relief rally, which looked promising but ultimately proved to be a head fake. Then came Thursday’s enormous reversal, which caught many investors completely off guard. It was remarkably easy to find ourselves on the wrong side of the market.

Even Friday’s bounce offered another glimmer of hope early in the session, only to fade by the closing bell.
Heading into the midterm elections, there was good reason to believe markets were already anticipating and preparing for a potential blue wave. While confidence in political polling has diminished, prediction markets had been signaling a larger-than-usual shift in Washington.
Of course, prediction markets are hardly infallible either. But they’ve become another useful tool many of us monitor as we try to understand what might unfold next.
Judging by the market’s negative reaction, even if it was delayed by a day, investors may not have fully anticipated the magnitude of the so-called blue tsunami or its potential implications. Suddenly, an election outcome that many believed was already priced in appeared to threaten the pro-business, market-friendly environment investors had grown accustomed to.

But was the election really responsible for everything we witnessed? I’m not so sure.
Markets have a habit of moving in strange and unexpected ways, often without an obvious explanation. And after the extraordinary optimism surrounding AI and the bull market earlier this year, sentiment has shifted so dramatically toward skepticism and negativity that we have to wonder whether the pendulum has swung too far in the opposite direction.
There’s also another possibility worth considering. Sometimes markets simply recognize a vulnerable environment and exploit it. When positioning becomes crowded, particularly with the widespread use of leverage and options, even relatively modest surprises can trigger extraordinary price movements. Selling feeds on selling, confidence evaporates, and what begins as an ordinary pullback can quickly turn into something much more dramatic.
Last week offered another reminder that something widely expected isn’t necessarily fully priced in. No matter how sophisticated markets become, human emotions and investor positioning remain powerful forces.
That is why I believe our priority must remain on what prices are actually doing rather than what we think they should be doing.
Our job isn’t to predict every twist and turn. It’s to protect capital when conditions deteriorate, recognize when selling pressure begins to subside, and be prepared to take advantage of the opportunities that emerge.
Why the Outlook Still Favors A Recovery
The historical evidence following midterm elections is remarkably favorable. Since 1950, the S&P 500 has gained ground in the 12 months following all 19 midterm elections, averaging a 15.1% advance. The seven occasions when a Republican president faced a Democratic Congress produced an average gain of 15.5%. The November-to-April period following midterms has also been particularly strong, averaging a 14.8% gain.
Those statistics certainly give us reasons for optimism over the coming months. However, they offer little protection against further weakness in the meantime.
A favorable historical environment doesn’t necessarily mean we have a favorable trading environment right now.
One possibility I’m watching closely is the 1978 correlation scenario we’ve discussed previously. While it hasn’t been my primary expectation, some of last week’s price action began to resemble that correlation.
I’m not suggesting the market must follow the same path. Historical comparisons are useful for considering what might happen, but they should never become substitutes for what is actually happening.
For now, the resemblance is another reason to respect the correction and remain flexible until the price action improves.
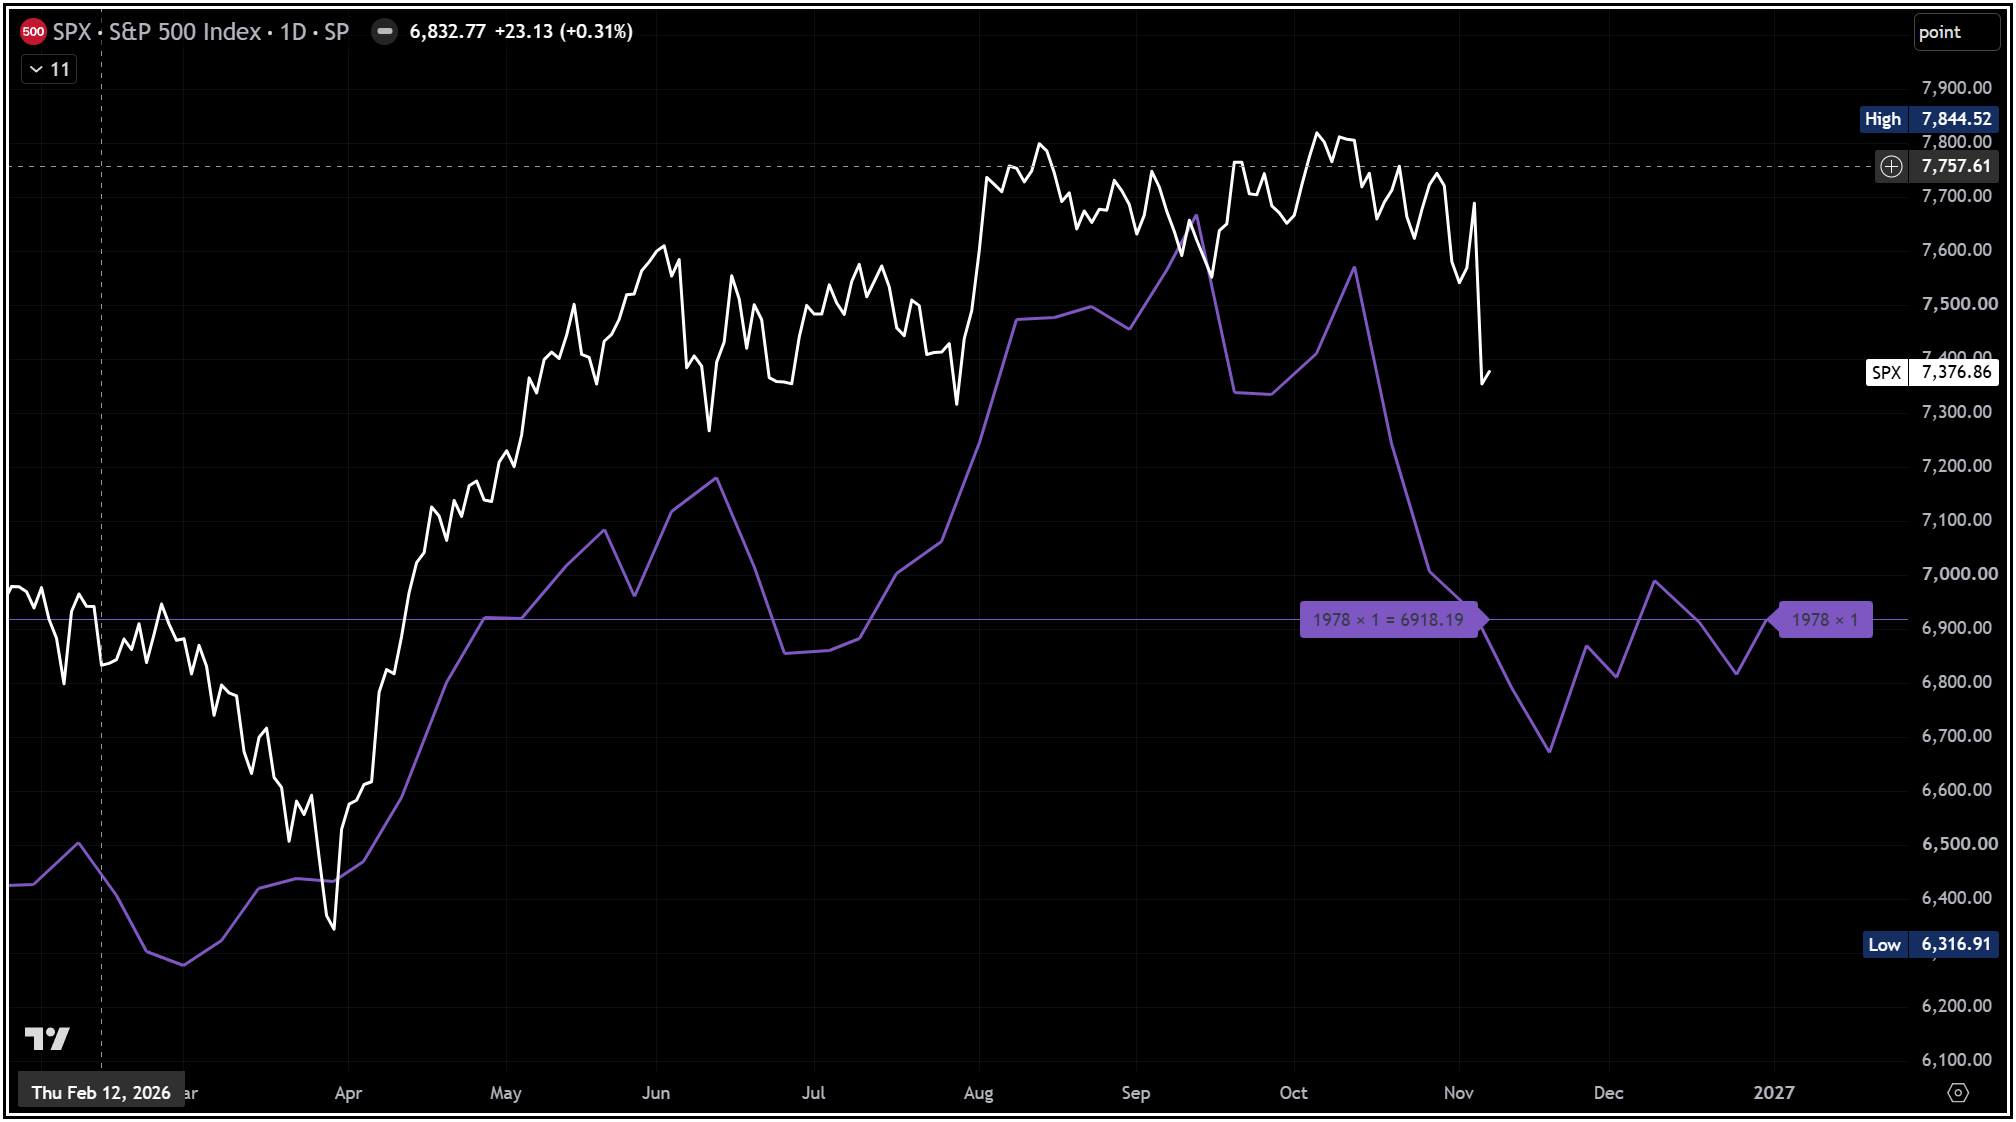
The important question is whether we’re witnessing the final stages of a liquidation event or the beginning of a more sustained decline. The answer will come from the market itself, not from historical statistics or political predictions.
With the S&P 500 approaching such an important technical test, I think it’s worth considering what could happen next and, more importantly, how we should prepare for the different possibilities. Here’s what I’m watching most closely and what would cause me to become either more constructive or more defensive in the days ahead.
Paid subscribers continue with three important takeaways, the market decision map, key SPX levels, three possible scenarios, upcoming catalysts, and the bottom line.
